
Join us on our journey towards renewable energy excellence, where knowledge meets innovation.

The Netherlands has quietly built one of Europe’s most sophisticated corporate PPA markets. Backed by an ambitious offshore wind pipeline, a growing concentration of data centres and energy-intensive manufacturers, and a regulatory framework in active transition, the Dutch market offers a compelling, if complex, environment for long-term renewable energy contracting.
In this article, we take a closer look at the factors shaping the Dutch PPA landscape. We start with an overview of the country’s energy mix and the current state of the PPA market. We then examine the regulatory environment, including the ongoing transition from the SDE++ subsidy scheme to contracts for difference (CfDs), and how these changes affect PPA attractiveness. Finally, we look at key market dynamics (including capture prices, PPA prices, negative price occurrences, and imbalance costs) that directly bear on PPA negotiations and project bankability.



🇳🇱 Netherlands PPA Market: Key Facts (2025)
What does the Dutch electricity mix look like in 2025?
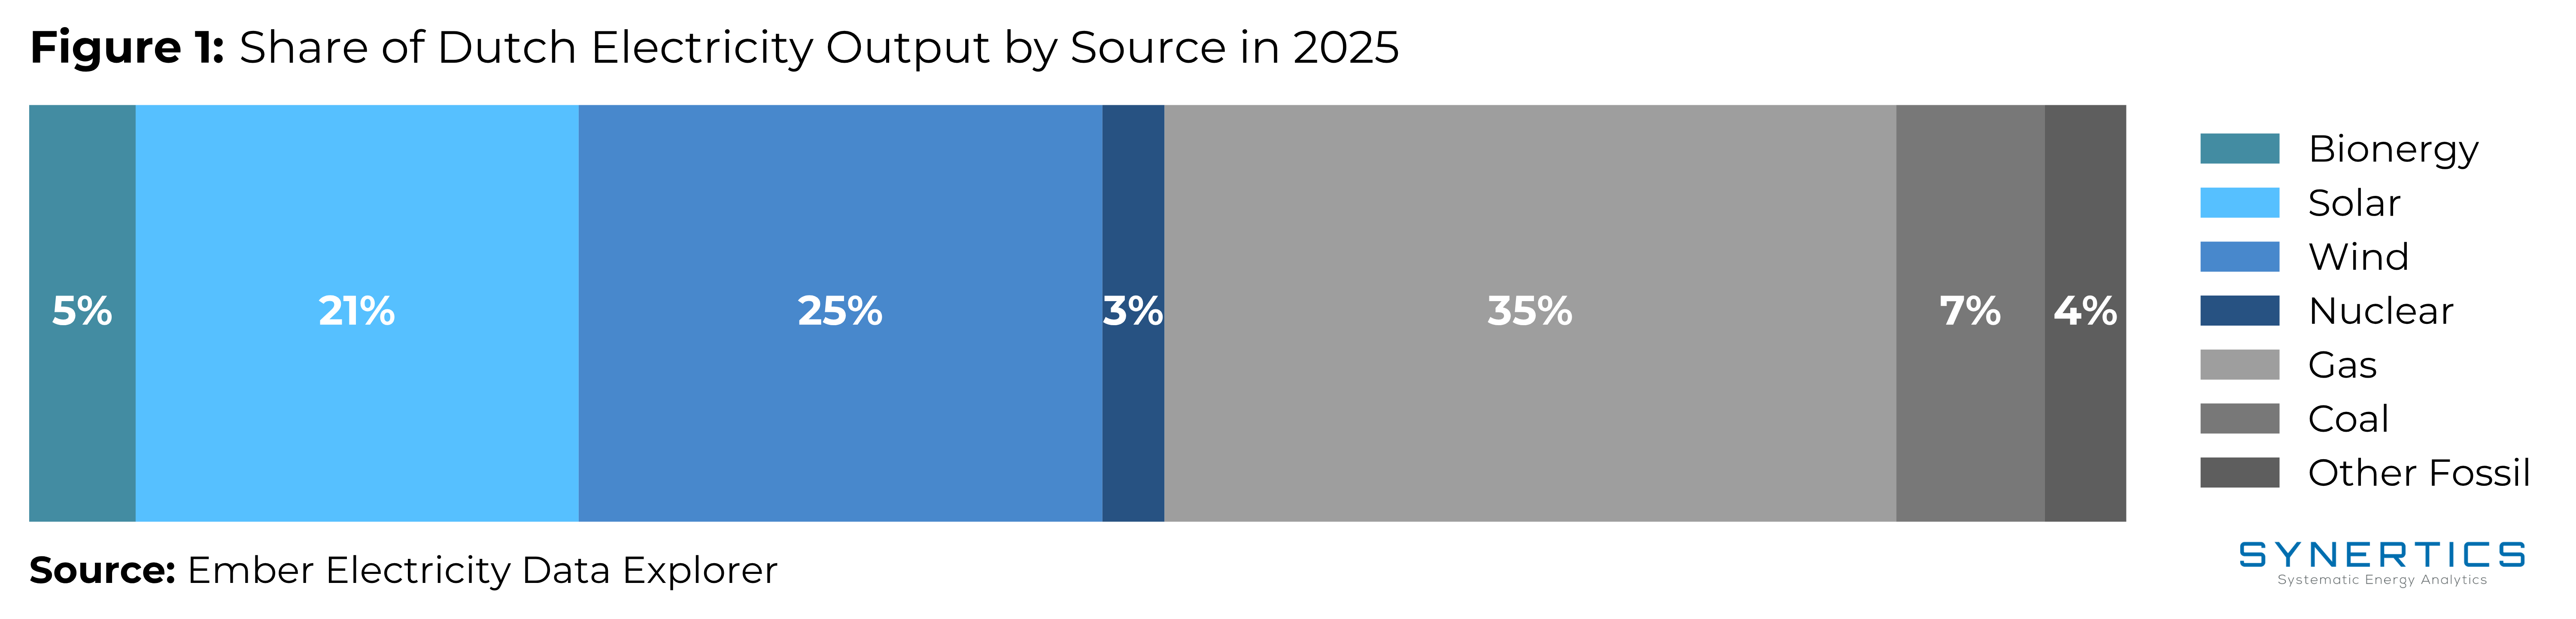
The Netherlands has made significant strides in its energy transition. In 2025, total electricity generation reached 134.96 TWh, with renewables accounting for just over 51% of the mix, a meaningful milestone for a country that has historically relied heavily on natural gas.
Wind is the largest renewable source in the Dutch electricity system, contributing 33.7 TWh or 25% of total generation in 2025, ahead of solar at 28.5 TWh (21%), reflecting the rapid build-out of utility-scale and rooftop PV capacity in recent years. Together they account for nearly half of all generation. Bioenergy added a further 6.85 TWh (5%), rounding out the renewable mix. Gas remains the single largest source overall at 47.09 TWh (35%), though its share is declining as renewables expand. Coal contributed 9.55 TWh (7%) and other fossil sources 5.23 TWh (4%). Nuclear contributes a modest 3.99 TWh (3%), with the Borssele plant currently the country’s only operating reactor.
The offshore wind expansion is particularly notable. Projects such as Hollandse Kust Noord (759 MW), Hollandse Kust West (2.2 GW), and IJmuiden Ver (6 GW) represent a substantial pipeline of new capacity, with the Dutch government targeting 23 GW of installed offshore capacity and up to 40 GW by 2040.
Overview of the Dutch PPA Market
The Netherlands has accumulated approximately 3.3 GW of cumulative contracted corporate PPA capacity (2.8 GW wind, 0.5 GW solar), ranking 6th in Europe behind Spain, Germany, Sweden, the UK, and France, according to the RE-Source PPA Deal Tracker. The market is dominated by large technology companies and energy-intensive industrials, a reflection of the country’s significant data centre footprint (the Amsterdam metropolitan area hosts one of Europe’s largest concentrations of hyperscale data centres) and its broad base of manufacturing and chemical industry offtakers.
The scale of individual transactions in the Netherlands is notably large by European standards, driven in particular by offshore wind PPAs. In early 2024, Google signed what was described at the time as its largest offshore wind PPA ever: a 478 MW agreement with Shell and Eneco across two Dutch offshore wind farms: Hollandse Kust Noord and Hollandse Kust West VI. In May 2025, Google and Shell extended their collaboration further, signing what is described as the first corporate PPA to extend the lifespan of an offshore wind farm: a deal securing 100% of NoordzeeWind’s 108 MW capacity for at least four additional years beyond its original decommissioning date. As of May 2025, Google has supported over 1 GW of clean energy generation capacity in the Netherlands through PPAs, among the largest single-country commitments by any corporate buyer in Europe.
Despite this activity at the top end of the market, the broader Dutch PPA landscape has faced headwinds. Market participants report that many potential offtakers, particularly mid-sized industrials, remain more comfortable with traditional energy procurement and have been slow to adopt long-term fixed contracts. The long-standing availability of the SDE++ subsidy scheme, which has historically provided generous and predictable support for renewable producers, has reduced producer urgency to pursue PPAs as an alternative revenue stream. This dynamic has constrained deal flow in the sub-50 MW segment that is most accessible to a wider range of corporate buyers.
SDE++ Subsidy Scheme
The cornerstone of Dutch renewable energy support has long been the SDE++ (Stimulering Duurzame Energieproductie en Klimaattransitie), a production-based subsidy that covers the gap between a project’s base production price and the prevailing market price, up to a maximum correction price. The SDE++ has been highly effective in driving renewable deployment: the 2024 subsidy round awarded 2.084 GW of new capacity across 629 projects, with solar PV dominating at 1.792 GW, including 1.237 GW of ground-mounted PV, 448 MW of rooftop, and 107 MW of floating PV. Notably, the round was significantly undersubscribed: of the €11.5 billion budget made available, only €5.6 billion was granted, suggesting that not all producers are rushing to take up subsidies, a dynamic that may partly reflect growing interest in alternative revenue routes such as PPAs.
However, the SDE++ creates a structural tension with PPA development. Because the scheme offers downside protection against low market prices, producers under SDE++ have less incentive to lock in long-term bilateral contracts. Conversely, while producers receiving SDE++ support can sell Guarantees of Origin (GOs), the revenue is deducted from their subsidy payment, reducing the green attribute value they can effectively offer to corporate buyers seeking to substantiate renewable claims.
How will the SDE++ to CfD shift change Dutch PPAs?
A significant regulatory shift is underway. In line with EU electricity market reform objectives, the Dutch Ministry of Climate Policy and Green Growth intends to replace the SDE++ with a two-way contract for difference (CfD) mechanism for offshore wind, onshore wind, and large-scale solar projects, with the first CfD tender planned for autumn 2027. Under a CfD, producers receive a top-up payment when market prices fall below a reference (strike) price, and reimburse the difference when prices exceed it.
To avoid crowding out private contracts, the CfD design includes an optional 'carve-out' mechanism that allows producers to voluntarily exclude a portion of their capacity from the CfD during the bidding procedure, retaining the ability to contract that volume through corporate PPAs. Producers opting for a carve-out receive a higher ranking in the tender, as they require less state support.
This transition is expected to materially change the PPA landscape. Under the SDE++, producers had little incentive to pursue PPAs since the scheme already provided downside revenue protection. Under a symmetric CfD, producers must return above-strike revenues to the government, giving them stronger reasons to seek complementary revenue structures outside the CfD. The carve-out mechanism creates a direct pathway for corporate PPAs to sit alongside state support rather than being crowded out by it.
Offshore Wind: The Zero-Subsidy Model
The Netherlands was among the first countries in Europe to develop large-scale offshore wind without government production subsidies. From Hollandse Kust Zuid onward, developers competed for offshore permits without state support, bidding on criteria including system integration and ecological design rather than subsidy levels.
The governing framework is the Offshore Wind Energy Roadmap (Routekaart Wind op Zee), which sets a current installed capacity target of 23 GW. Looking further ahead, the North Sea Wind Energy Infrastructure Plan, published in July 2025, established a longer-term target of 30 to 40 GW by 2040.
The zero-subsidy model came under pressure when the Nederwiek Site I-A tender received no applications. As RVO noted: "Due to rising costs and less demand for electricity than expected, development of offshore wind energy is stalling." In response, the Ministry of Climate Policy and Green Growth published an Offshore Wind Energy Action Plan, which includes a transition to a two-way Contract for Difference mechanism for future offshore tenders, with the first CfD-backed tender planned for late 2027.
Guarantees of Origin
The Netherlands operates within the European GO system administered domestically by VertiCer (formerly CertiQ) under the overarching Association of Issuing Bodies (AIB) framework. While assets receiving SDE++ subsidies are legally eligible to issue GOs, the traditional SDE++ framework factors the market value of these green attributes into its annual subsidy clawback (correction amount) calculations. This financial deduction has historically created pricing and structural complexities for developers trying to bundle GOs into corporate PPAs. The transition to CfDs is expected to alter how these green attributes are allocated and valued, though corporate buyers must closely monitor the final design of the Dutch framework as implementation approaches 2027.
Are solar or wind PPAs more exposed to capture-price risk in the Netherlands?
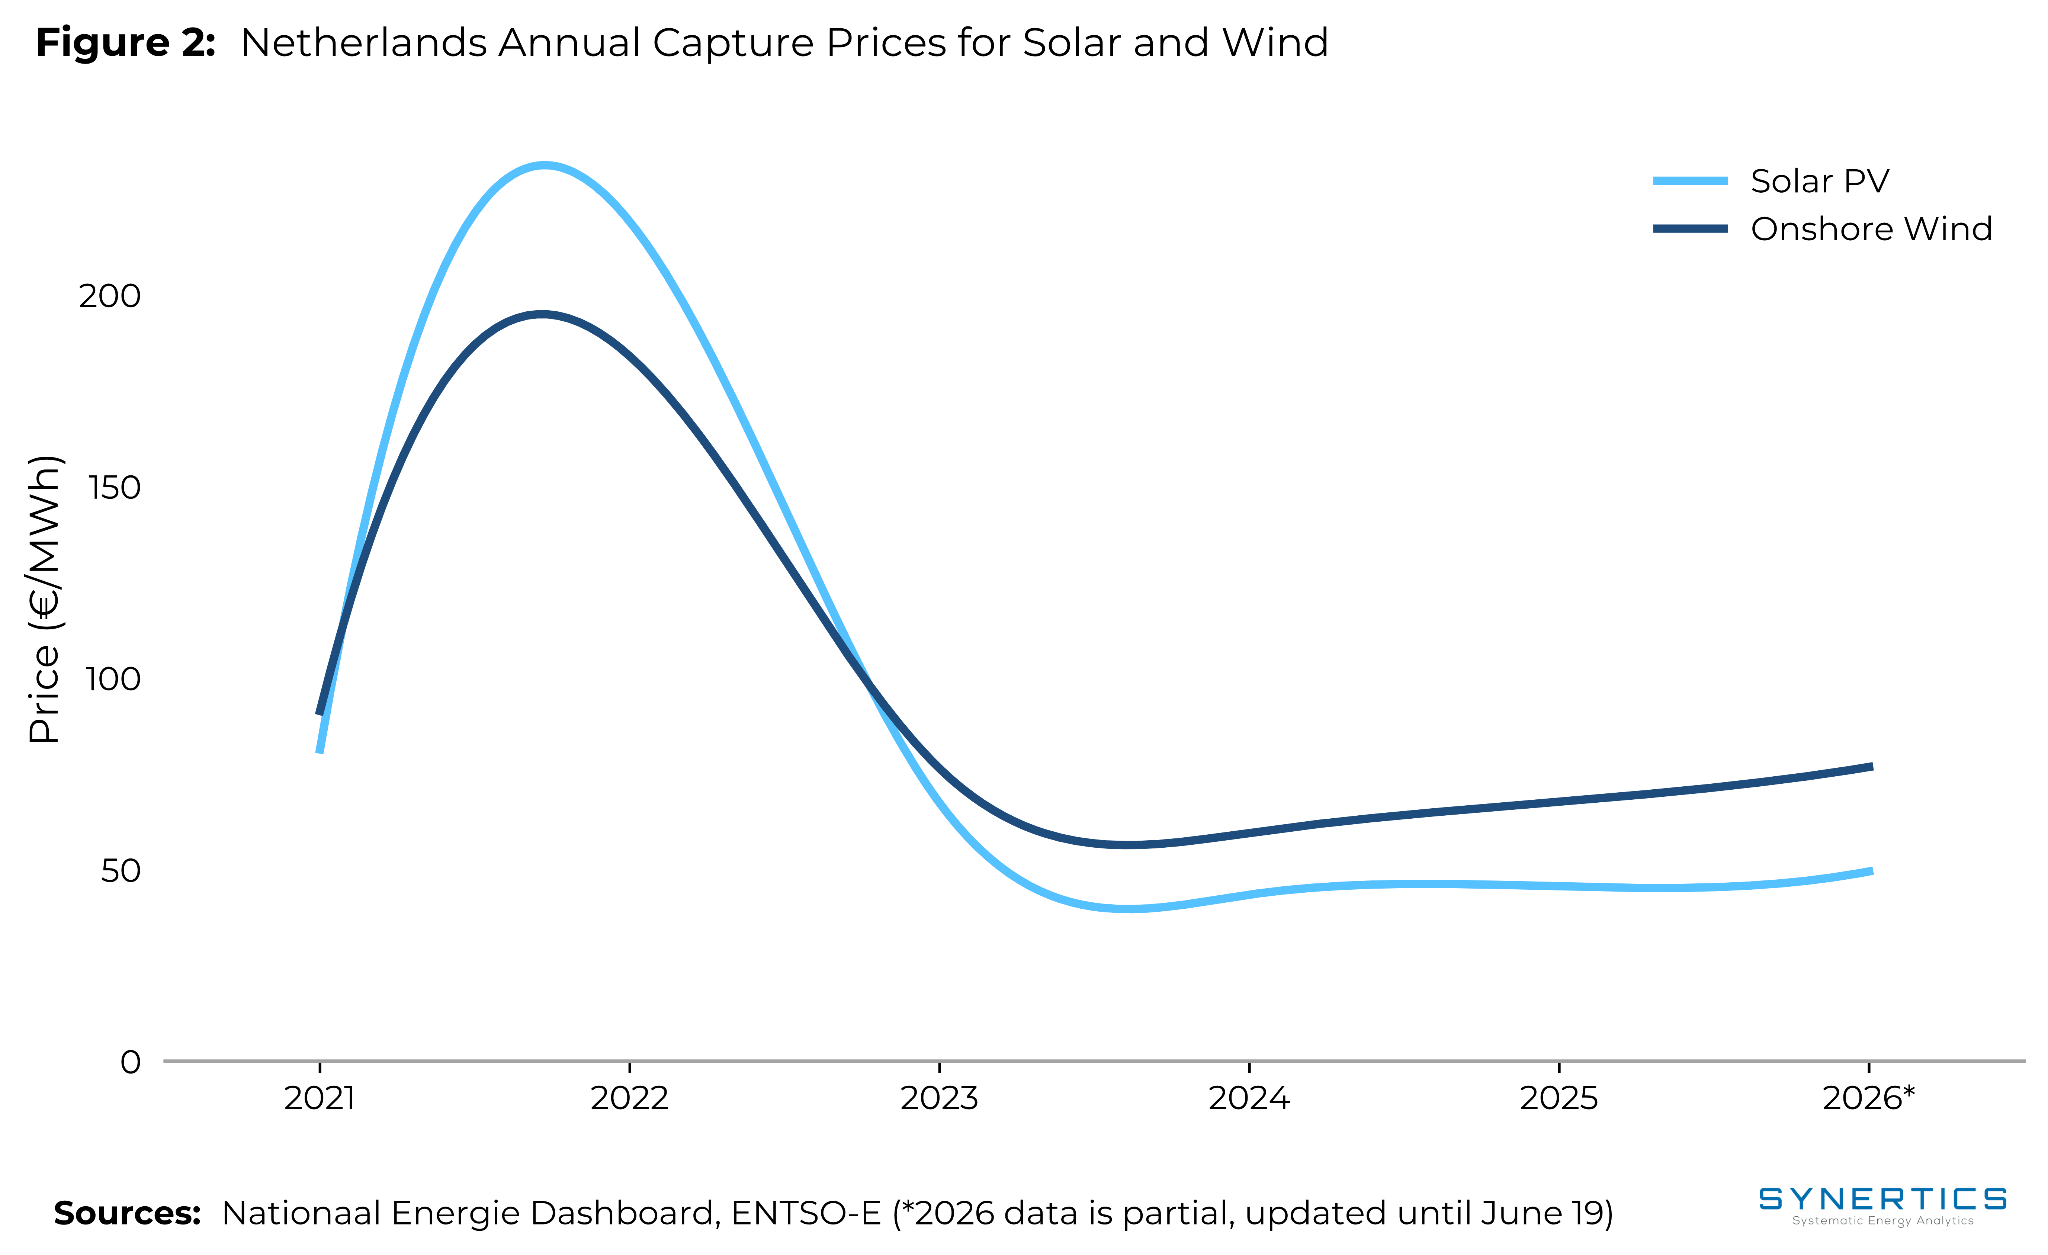
The rapid expansion of solar PV capacity in the Netherlands, from 11.1 GW in 2020 to 29.3 GW in 2025, has driven a structural decline in solar capture prices. As more solar capacity is generated simultaneously during peak irradiance hours, revenues are increasingly compressed by oversupply at midday.
Both technologies saw exceptional prices in 2022 during the energy crisis. Stripping that out, the underlying trend is clear: solar capture prices fell from €81/MWh in 2021 to €43/MWh in 2024 and €46/MWh in 2025. Wind has proved significantly more resilient, declining from €91/MWh in 2021 to €60/MWh in 2024 before recovering to €68/MWh in 2025, reflecting a generation profile that is less concentrated during low-price midday hours.
For corporate buyers evaluating a pay-as-produced PPA structure, this divergence has direct implications for price risk allocation. Solar PPAs carry increasing capture price risk that annual average pricing assumptions do not fully reflect, while wind PPAs have delivered more stable and predictable revenue performance.
PPA Prices
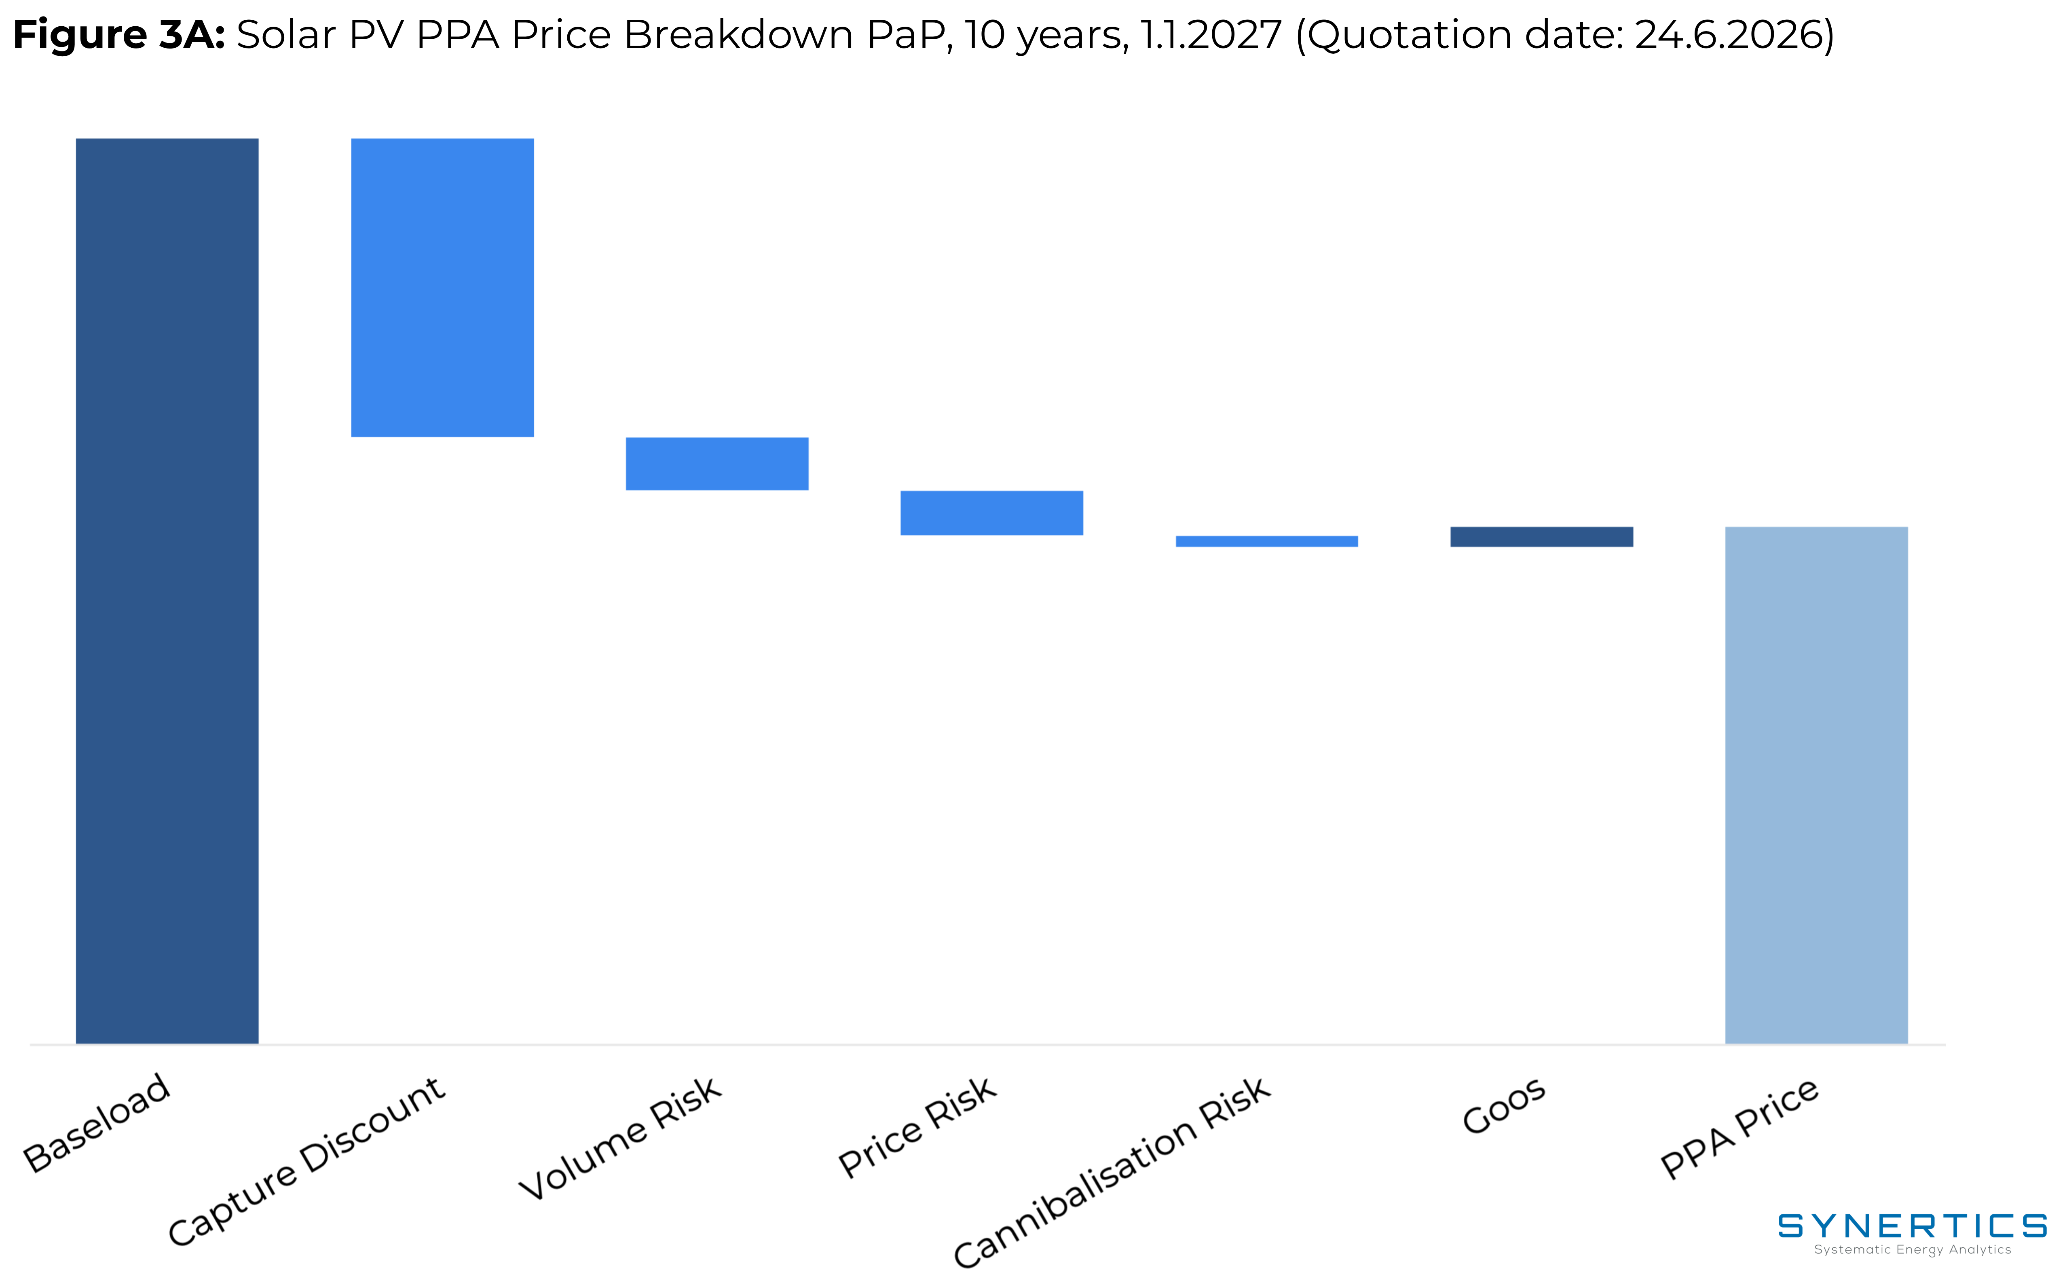
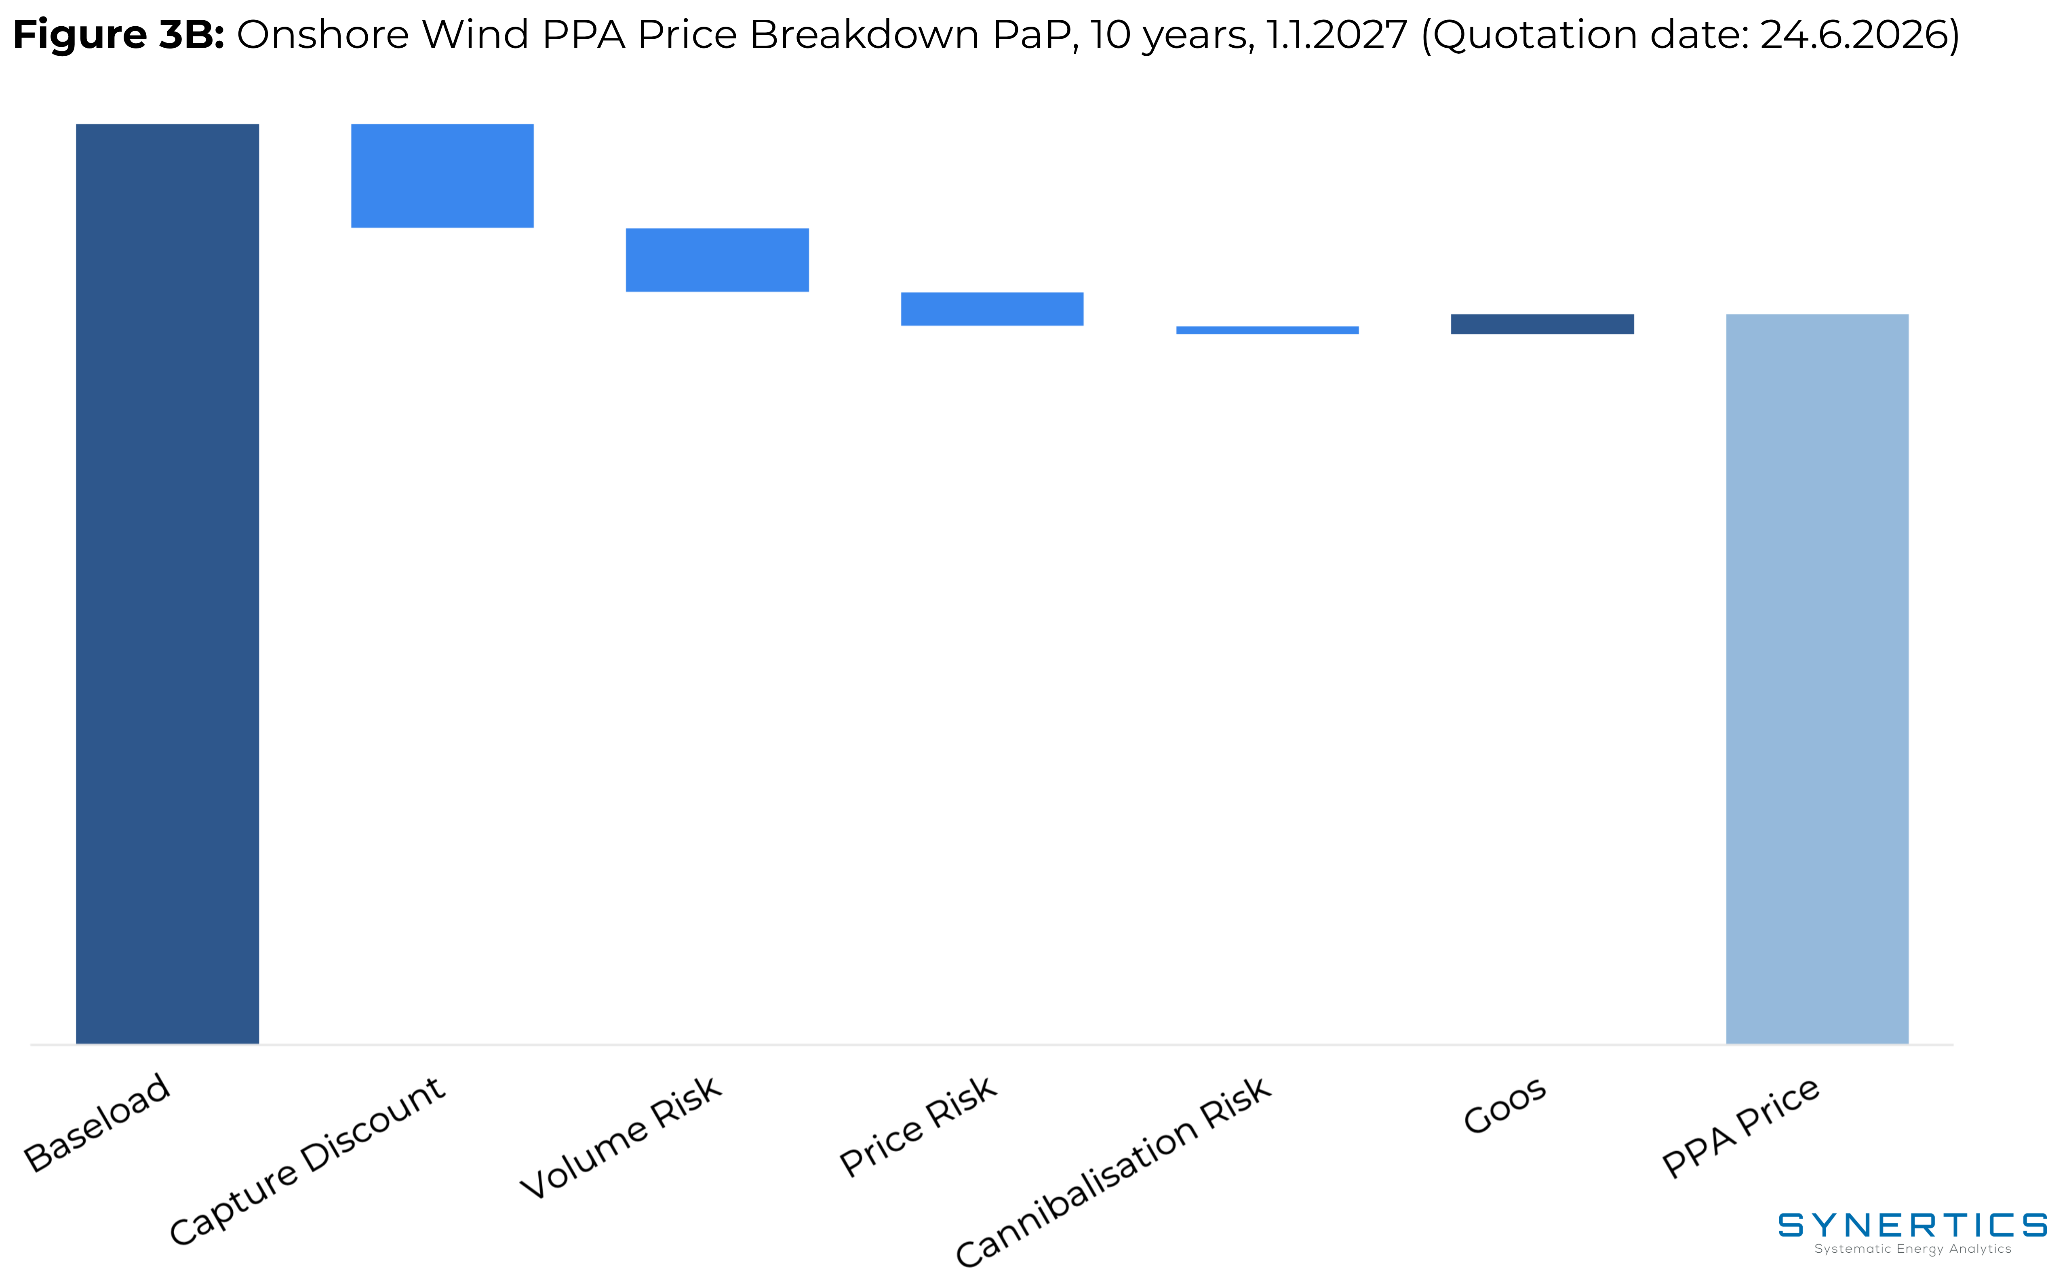
The Dutch corporate PPA market currently reflects a significant price gap between technologies, moving far beyond a simple alignment with baseline power markets. While underlying long-term baseload futures provide a foundational benchmark, actual off-take pricing depends heavily on production profiles and technology-specific risks. This dynamic has created a stark valuation premium for wind assets over solar generation, driven by the varying impact of market deflation on each asset class.
For solar assets, the long-term fixed PPA price reflects a steep profile discount. The solar capture price sits roughly one-third below the average baseload benchmark, a direct consequence of expanding solar capacity across the Netherlands. This growing midday penetration creates intense price cannibalization during peak generation hours, compressing the market value of solar power. As a result, a ten-year fixed solar PPA in the Netherlands currently prices at approximately €41.70/MWh.
In contrast, wind assets command a notable premium because their generation profile is distributed more evenly across off-peak, evening, and nighttime hours. The wind capture price remains far more resilient relative to the baseload reference, and a ten-year fixed wind PPA currently prices at approximately €57.90/MWh. This spread of over €16/MWh highlights the core trade-off facing corporate buyers: while solar offers a lower entry point, wind provides a superior natural hedge against daytime market deflation.
How often do negative prices occur in the Dutch market?
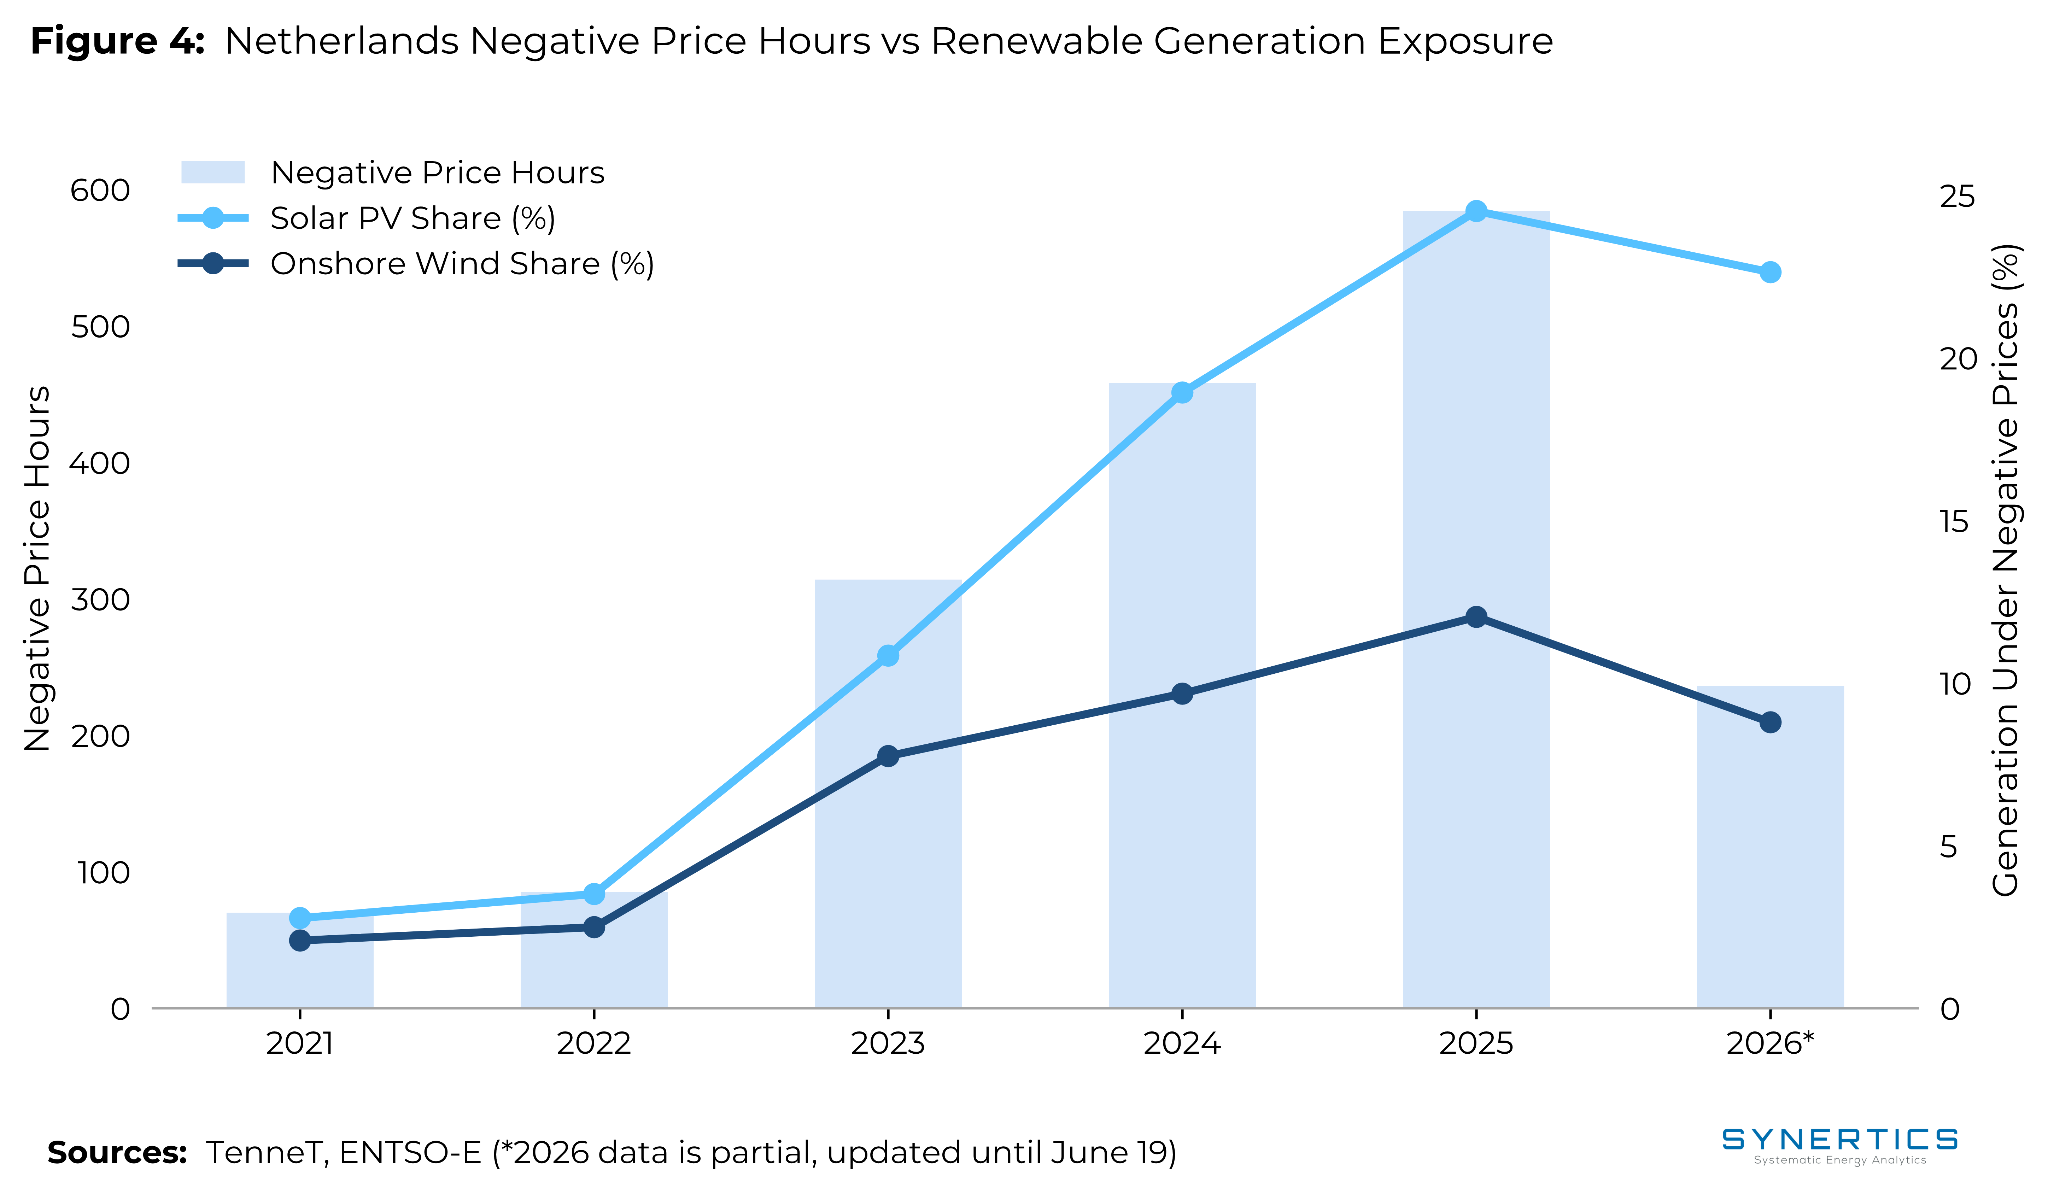
Negative electricity price occurrences have increased sharply in the Netherlands, rising from 70 hours in 2021 to 584 hours in 2025, an eightfold increase over four years. The acceleration was particularly pronounced between 2022 and 2023, when hours more than tripled from 85 to 314, driven by rapid solar capacity additions.
The exposure of renewable generation to these periods has grown in parallel. In 2025, 24.5% of solar generation occurred during hours of negative prices, up from 2.8% in 2021. Wind is considerably less exposed but not immune: 12% of wind generation fell in negative price hours in 2025, compared to 2.1% in 2021.
For PPA negotiations, this matters directly. Pay-as-produced structures expose buyers to volumes generated during negative price periods unless floor provisions or curtailment rights are included. Both parties are increasingly incorporating these protections, curtailment rights, price floor mechanisms, or fixed price structures, into Dutch PPA contract terms.
Imbalance Costs
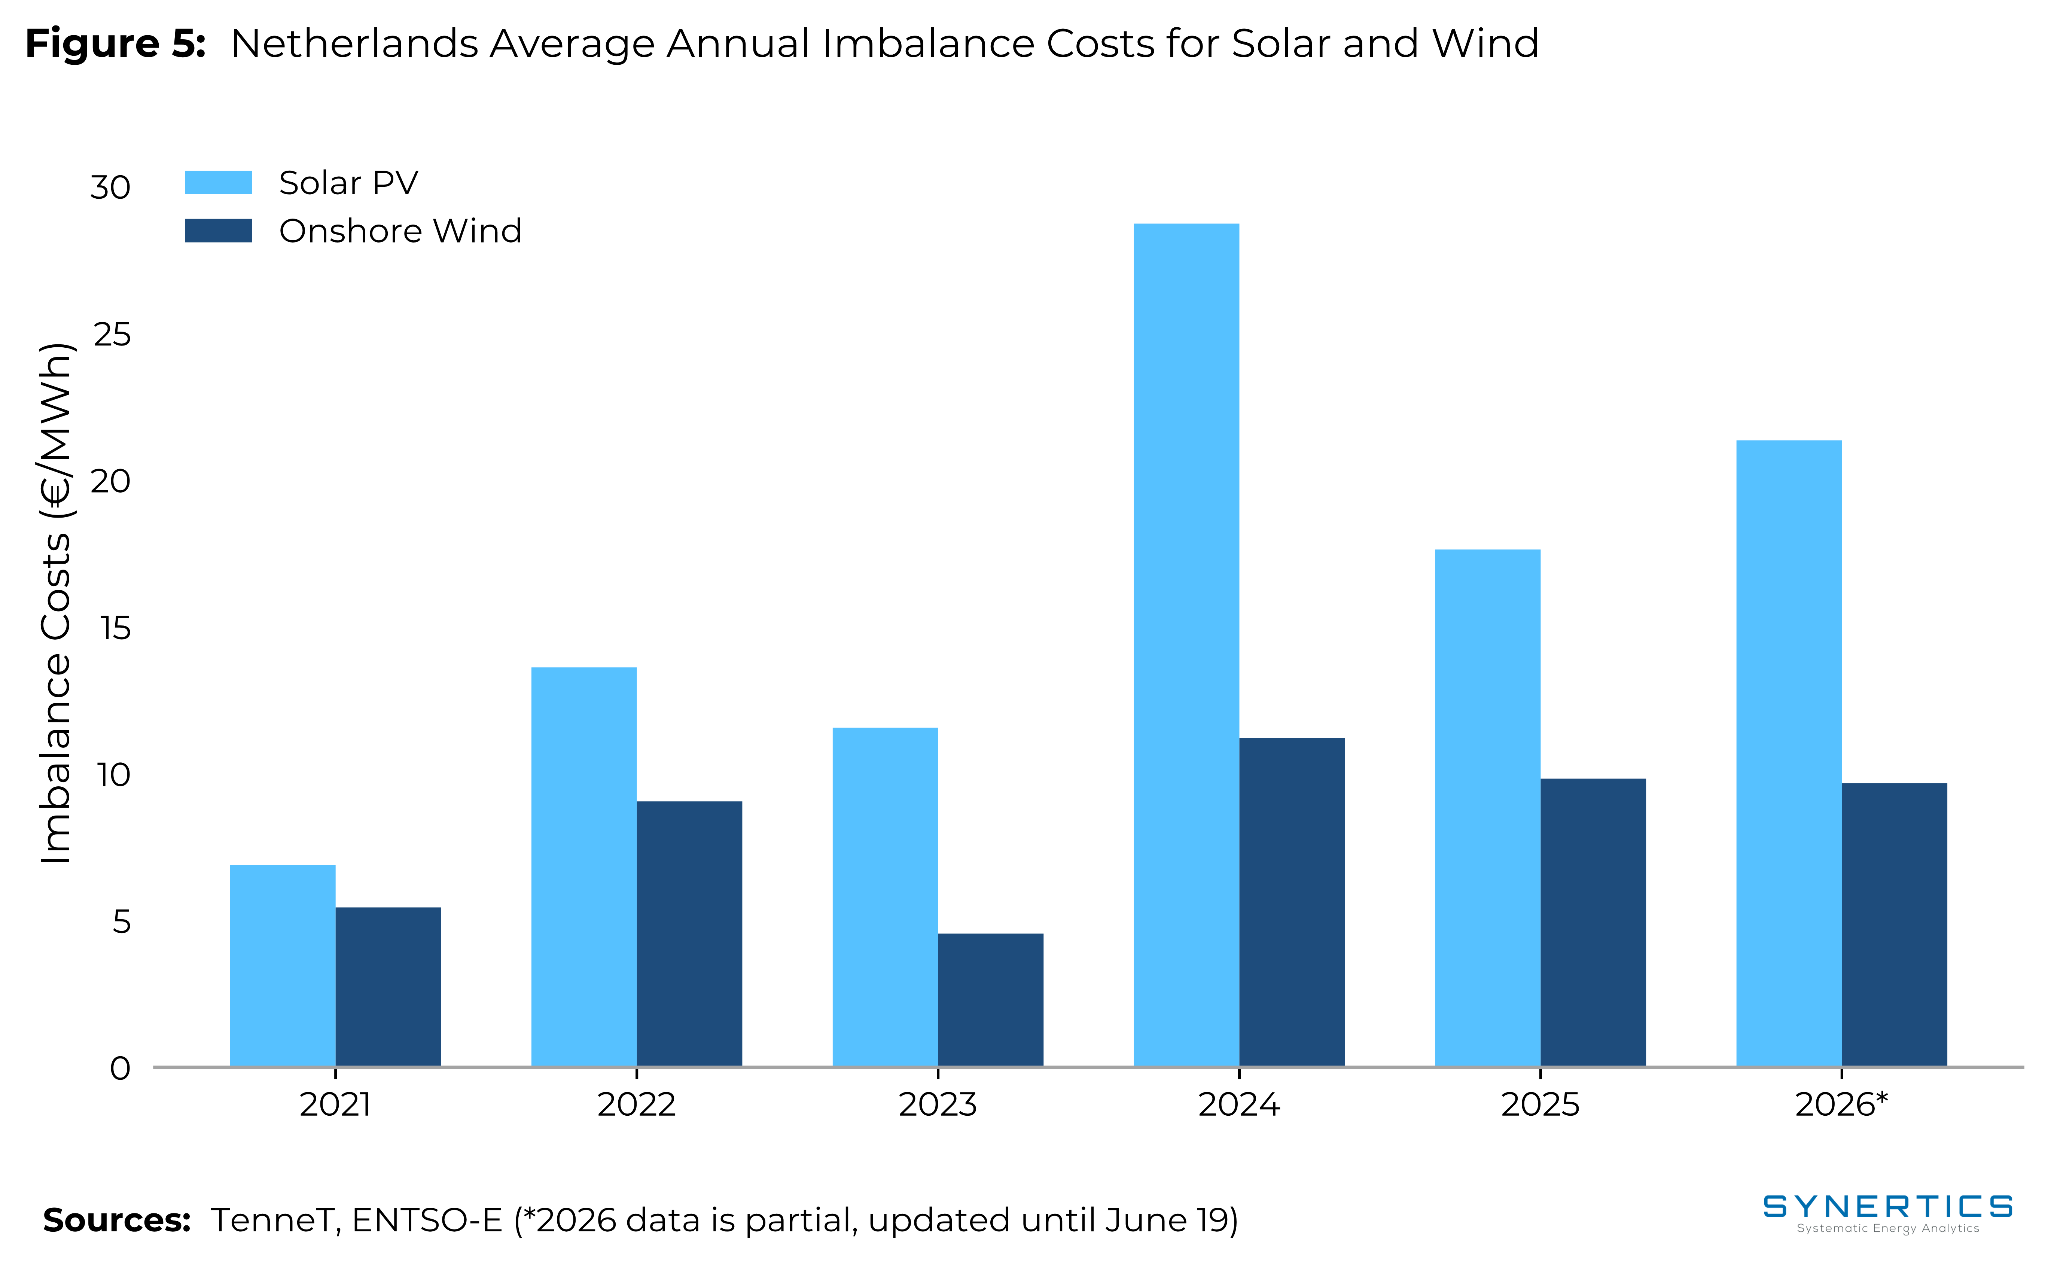
Imbalance costs are a material and measurable cost component for renewable generators in the Netherlands. TenneT, the Dutch TSO, settles imbalances per 15-minute program time unit (PTU), with the price set by the most expensive activated balancing bid in the domestic market. In most periods a single imbalance price applies to all participants, but when TenneT activates both upward and downward regulation within the same PTU, known as regulation state 2, prices split to penalise positions on both sides, creating strong incentives for accurate forecasting particularly during volatile renewable generation conditions.
Annual data from 2021 to 2025 illustrates a clear and widening divergence between technologies. Solar PV imbalance costs rose from €6.9/MWh in 2021 to a peak of €28.7/MWh in 2024, before easing to €17.6/MWh in 2025. Wind costs have remained considerably lower and more stable, reaching €9.8/MWh in 2025 after ranging from €4.6/MWh in 2023 to €11.2/MWh in 2024. The gap between the two technologies, less than €1.5/MWh in 2021, reached €17.5/MWh in 2024, reflecting the growing unpredictability of solar output as fleet size increases.
In PPA structures, imbalance risk is typically allocated to the generator. Buyers should pay attention to how imbalance provisions interact with the overall price structure, particularly where a contract references a fixed delivered volume rather than pure pay-as-produced output.
The Netherlands occupies a distinctive position in the European PPA landscape: a market with large, sophisticated corporate buyers, an unmatched offshore wind pipeline, and regulatory change that is set to materially shift producer incentives toward bilateral contracting over the next two years.
The transition from SDE++ to CfDs by 2027 is the single most important structural development for the Dutch PPA market in the near term. As producers lose access to asymmetric downside subsidies, PPAs will increasingly become a primary rather than supplementary revenue tool, driving deal flow and broadening market participation beyond the large-cap tech segment that has dominated volume to date.
The growth in negative price hours underlines the importance of careful contract structuring. Both buyers and sellers face meaningful basis risk between fixed contracted prices and realised capture rates, particularly for solar assets and during shoulder seasons when renewable oversupply is most acute. Offshore wind PPAs, while also affected, benefit from stronger and more predictable capture price performance, and the Netherlands’ position as a global leader in offshore wind development ensures a sustained supply of high-quality long-term contracts for well-capitalised corporate offtakers.
For buyers navigating the Dutch market, the key considerations are contract structure (pay-as-produced versus fixed-shape), negative price treatment, GO eligibility under the evolving subsidy framework, and the timeline risk associated with offshore projects still working through permitting and connection queues. At Synertics, we help corporate buyers and producers navigate these complexities, from PPA pricing and structuring to contract negotiation and ongoing performance monitoring. Get in touch to find out how we can support your energy procurement strategy in the Netherlands.

 3 min
3 min
Insights
19th Sep, 2026
3 min
Insights
11th Sep, 2026
2 min
Insights
3rd Sep, 2026