
Join us on our journey towards renewable energy excellence, where knowledge meets innovation.

Solar capture rates have fallen by roughly 40 percentage points across Germany, Spain, France and Portugal since 2022, while wind capture rates have stayed broadly flat. Here's what four years of day-ahead price and generation data show and what it means for PPA pricing and project bankability in 2026.



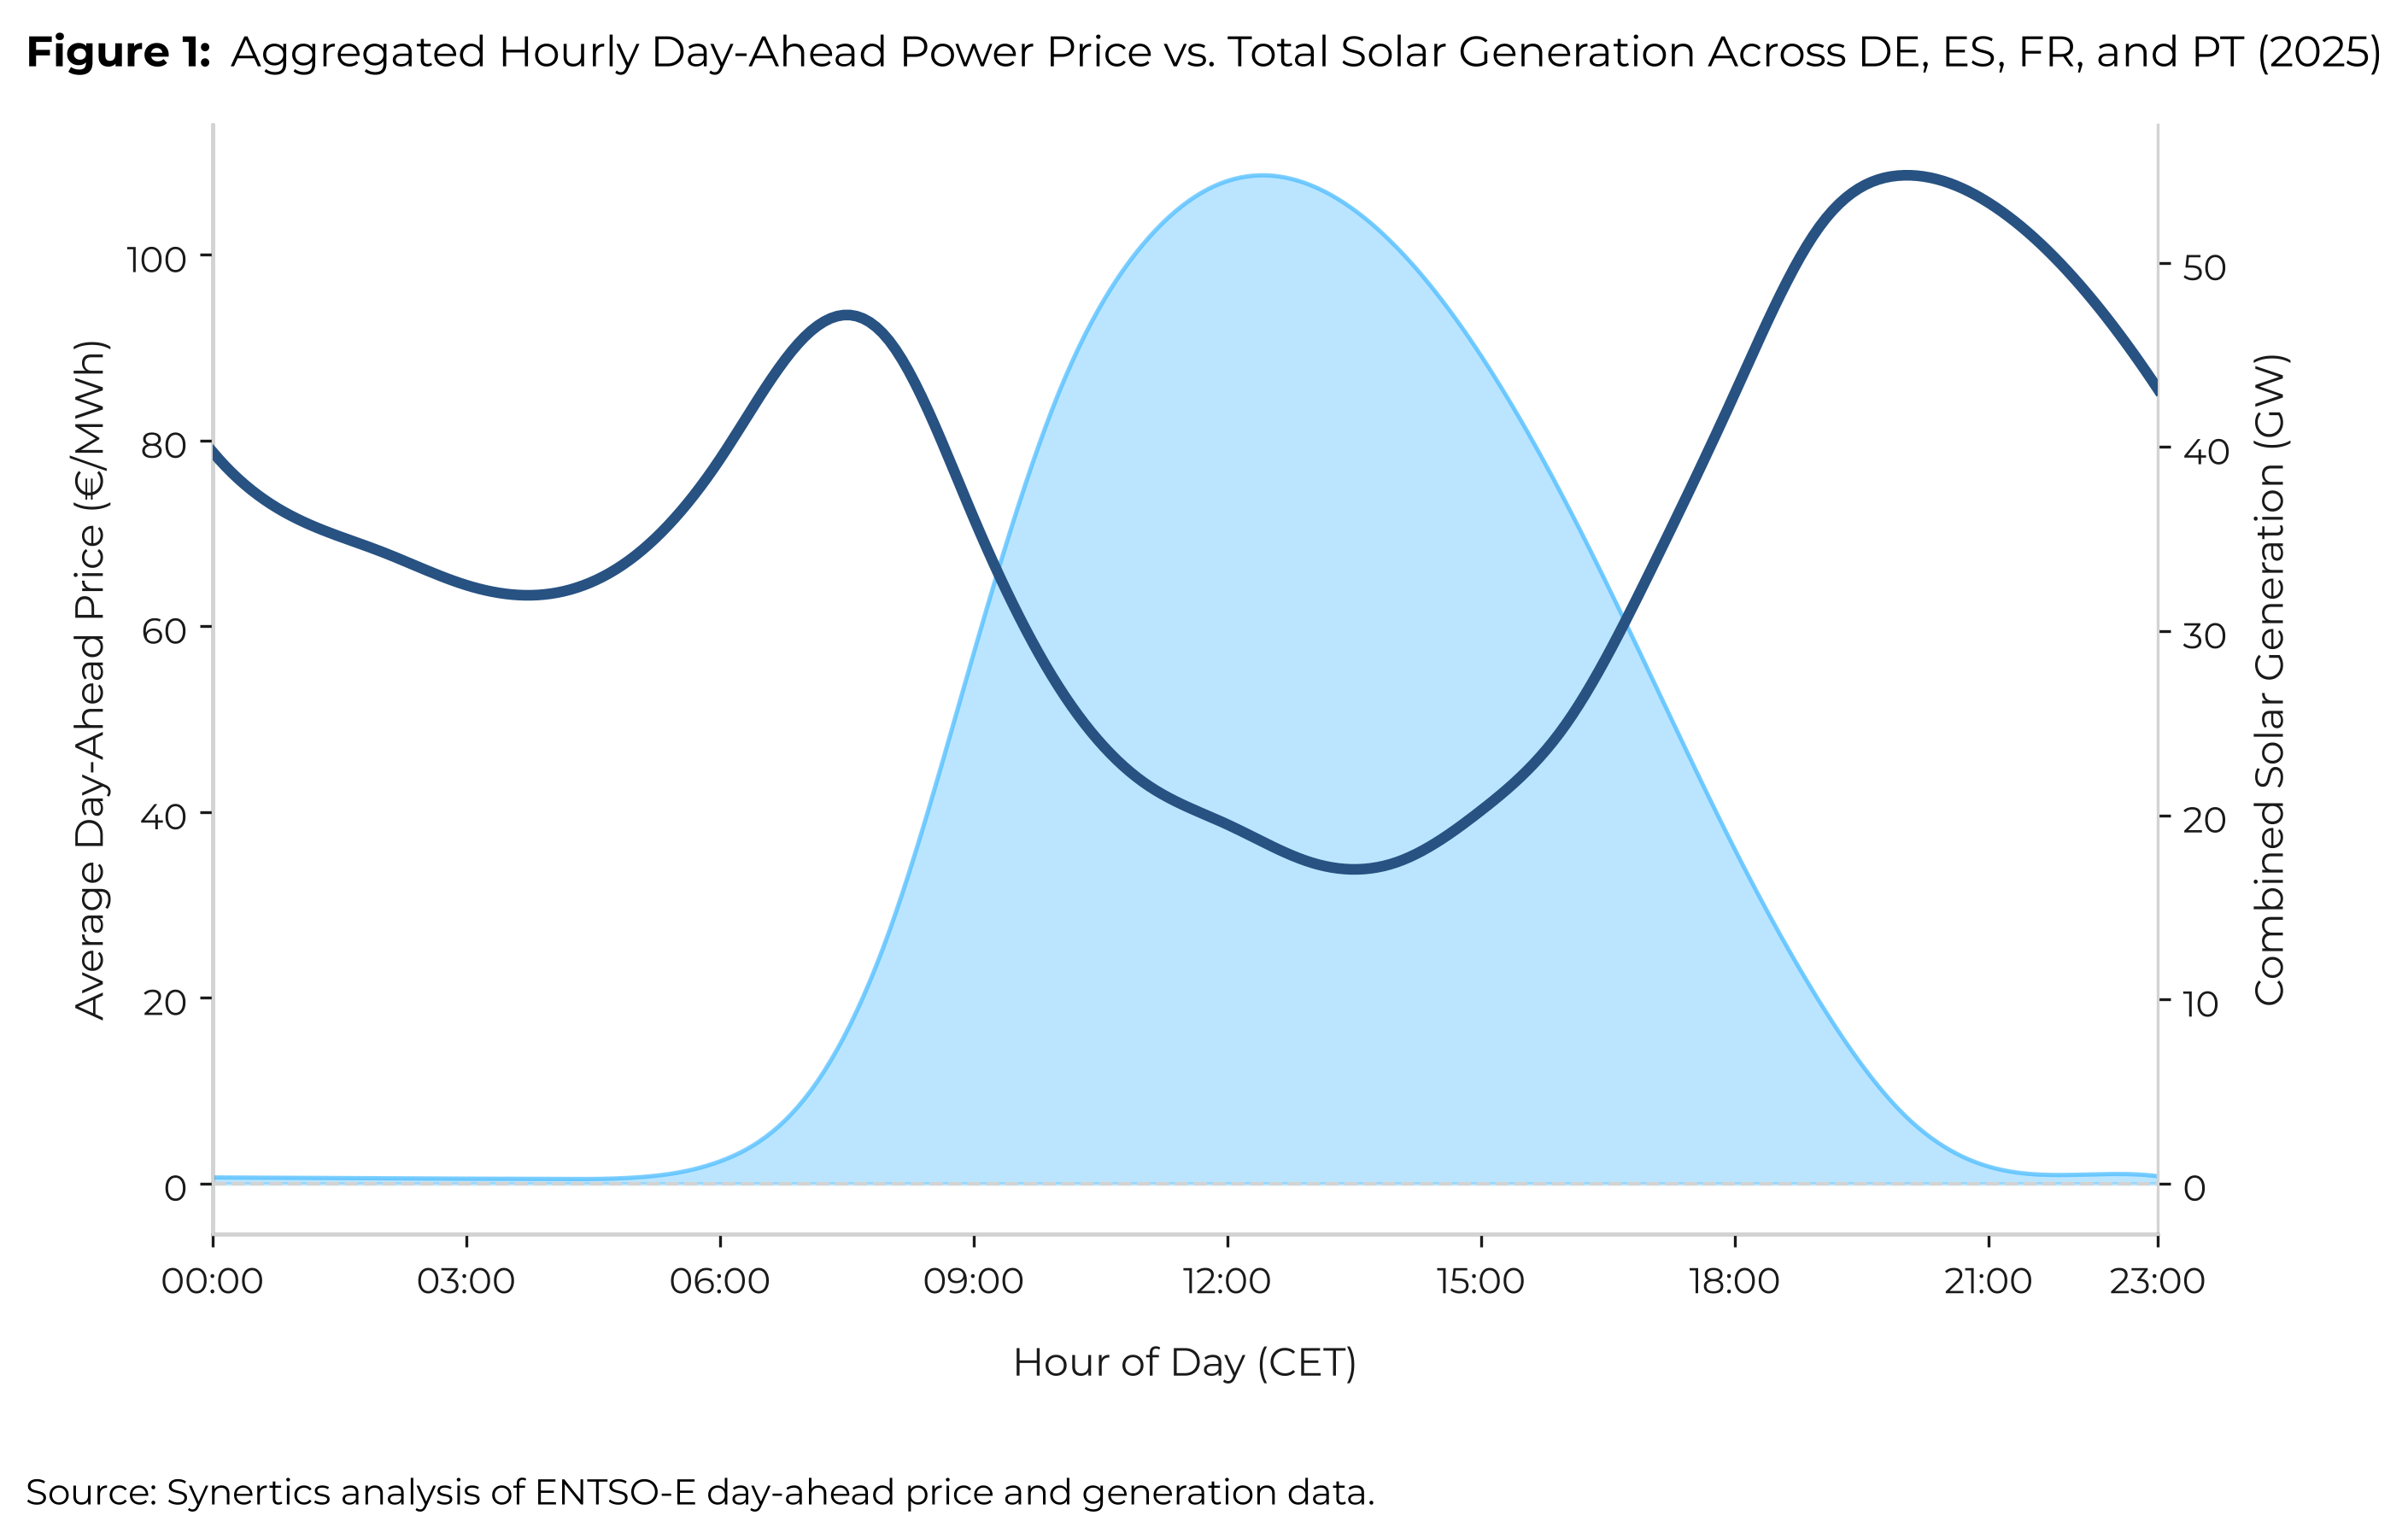
Solar has a pricing problem it created for itself. Because photovoltaic generation is hyper-concentrated within the exact same peak daylight hours, every additional gigawatt installed pushes wholesale market prices lower precisely when panels are producing the most power. This is price cannibalisation: solar assets competing against each other for a static window of demand, crushing capture rates and frequently pushing spot prices below zero. Unlike wind, whose generation profile is distributed across 24 hours and varying weather systems, solar has no natural time-of-day hedge.
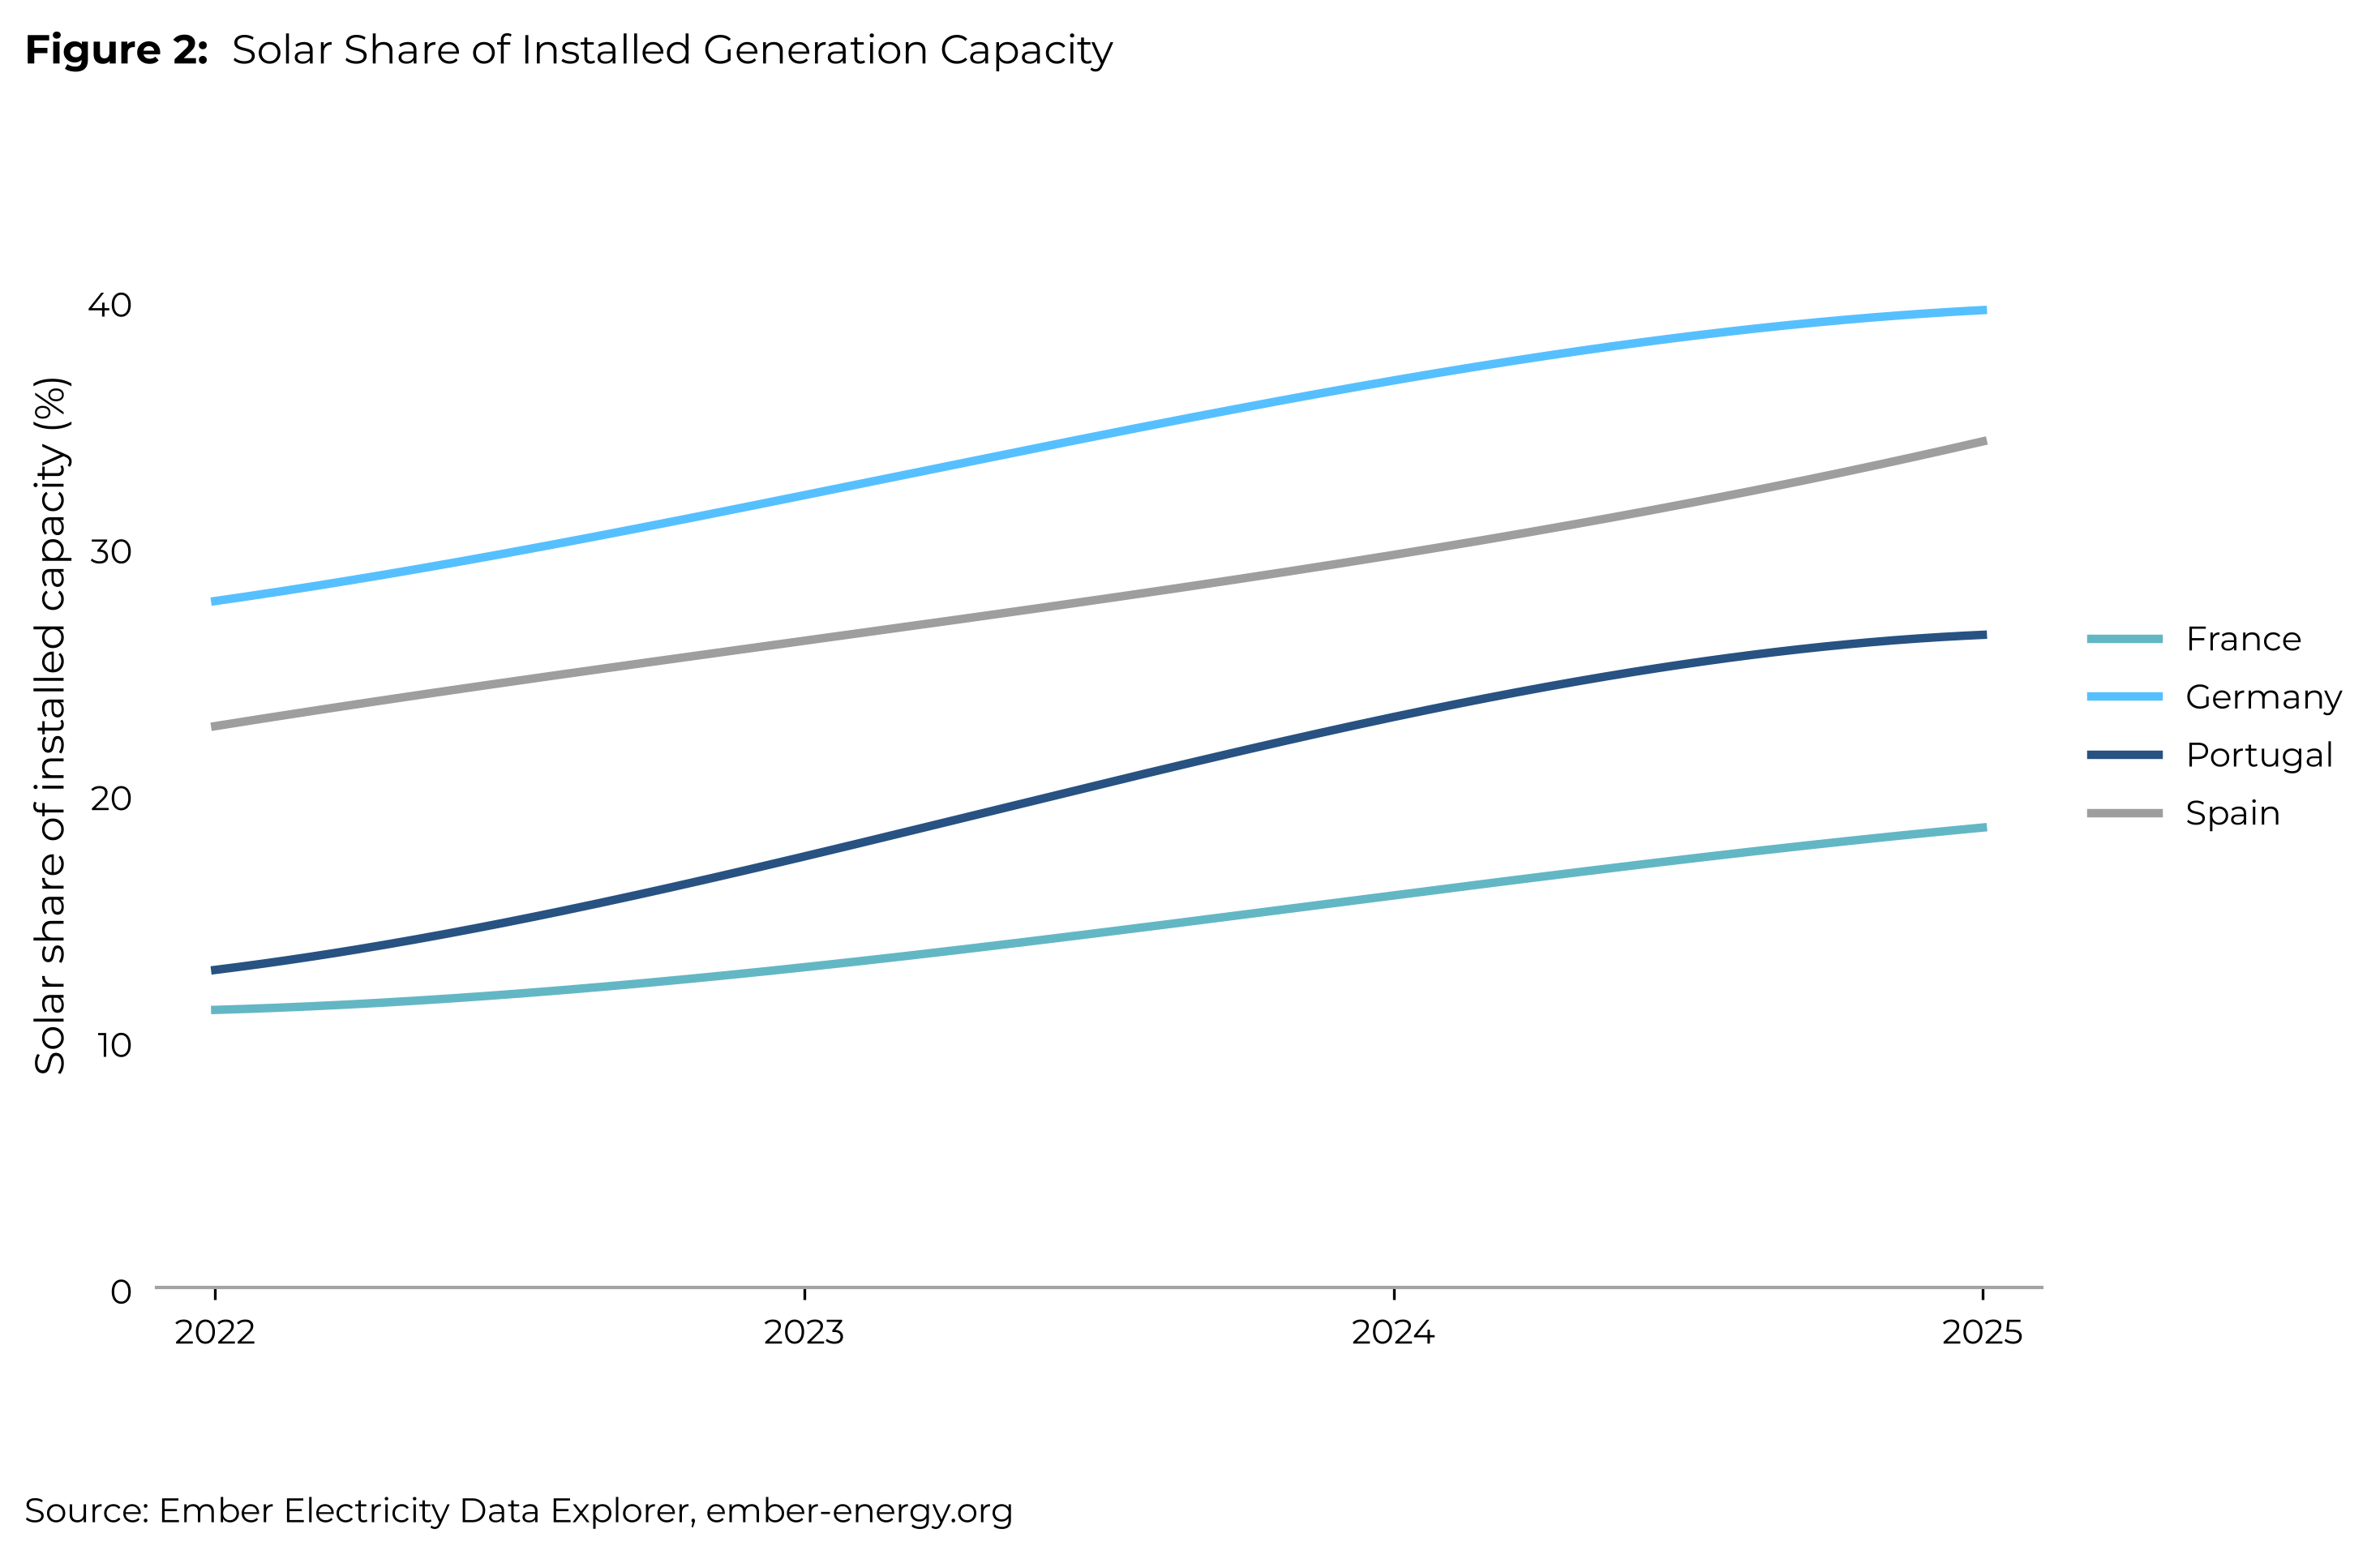
None of this is a coincidence in timing, it tracks a genuine surge in installed solar capacity across all four markets since 2022. Portugal has nearly two-and-a-half times its 2022 solar fleet, up from 2.8 GW to 6.9 GW by 2025, with solar's share of total power capacity more than doubling from 13% to 26% over the same period. Spain added over 20 GW in three years, from 26.2 GW to 47.2 GW, taking its capacity share from 23% to 34%. Germany, already the largest fleet by far, still grew from 61.2 GW to 106.3 GW, a 74% increase, pushing solar past 39% of total installed capacity. France grew more modestly in absolute terms but nearly matched the others in pace, up 86% from 16.8 GW to 31.2 GW.
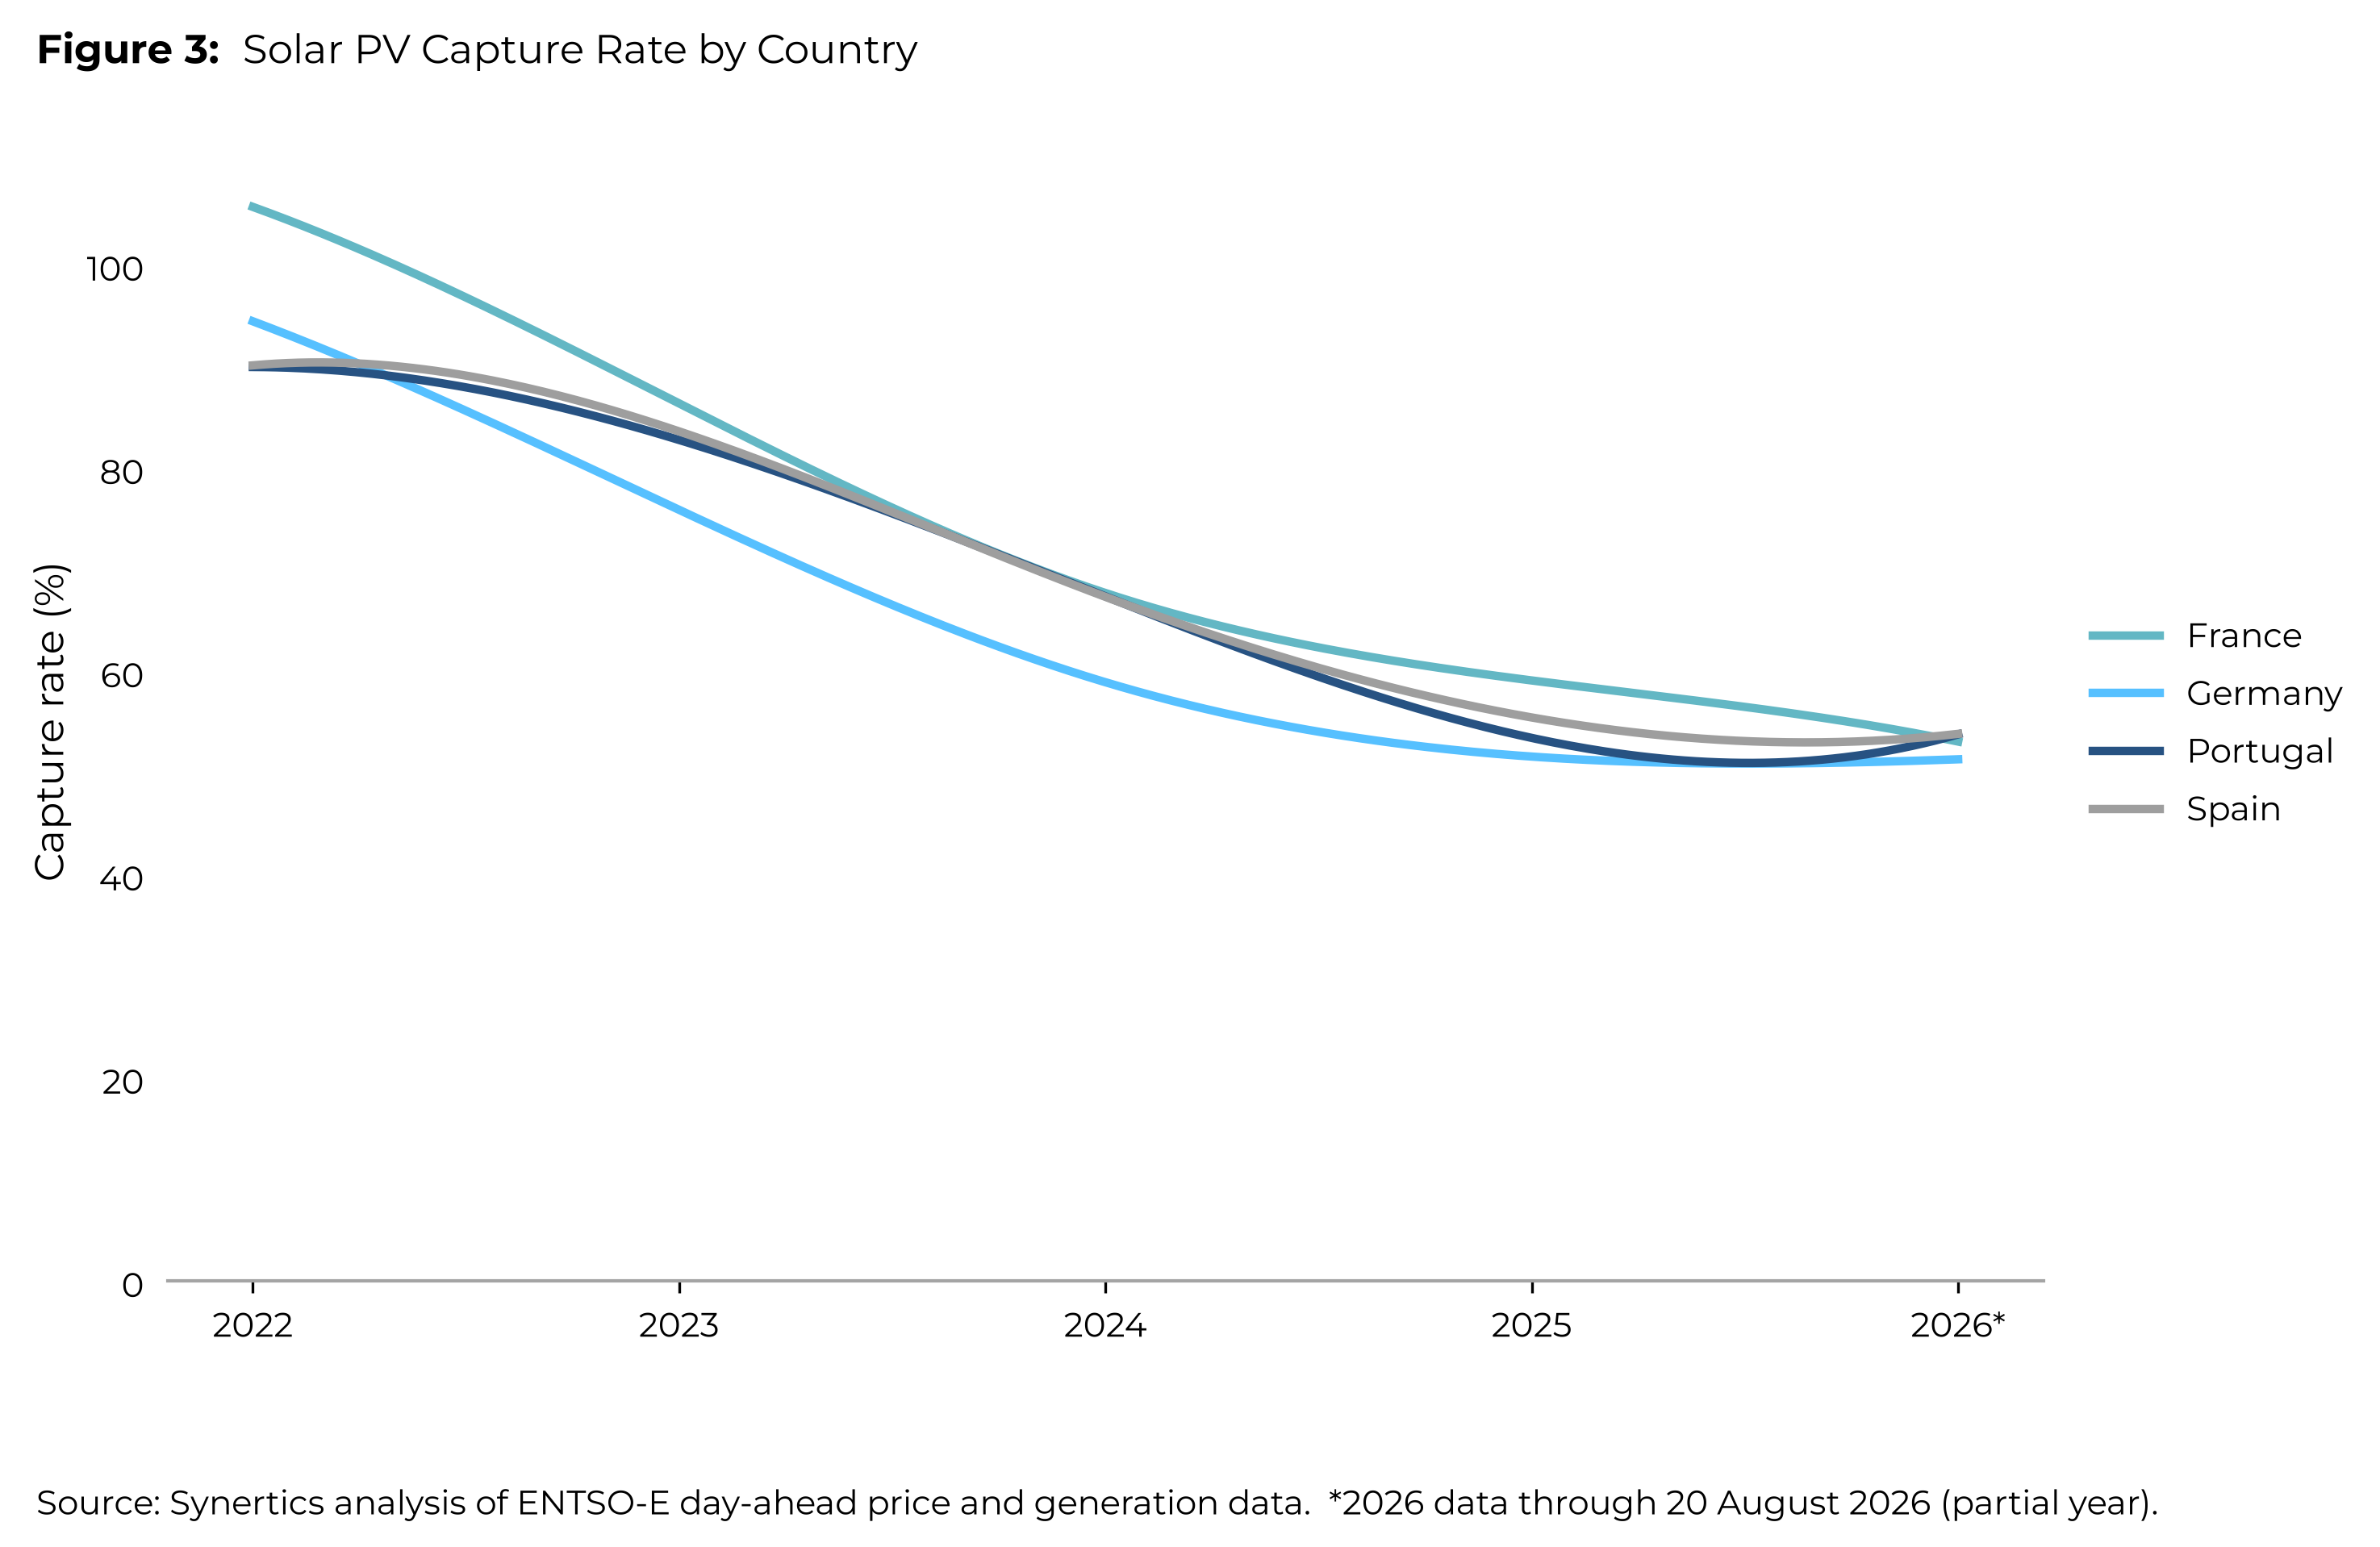
Solar's capture rate (the share of the average market price solar earns, since it sells disproportionately into the hours it depresses) has collapsed across all four markets since 2022. Germany fell from 94% to 51%, Spain from 90% to 54%, Portugal from 90% to 54%, and France from 106% down to 53%. In every market, solar now captures roughly half of the average wholesale price it would have earned four years ago.
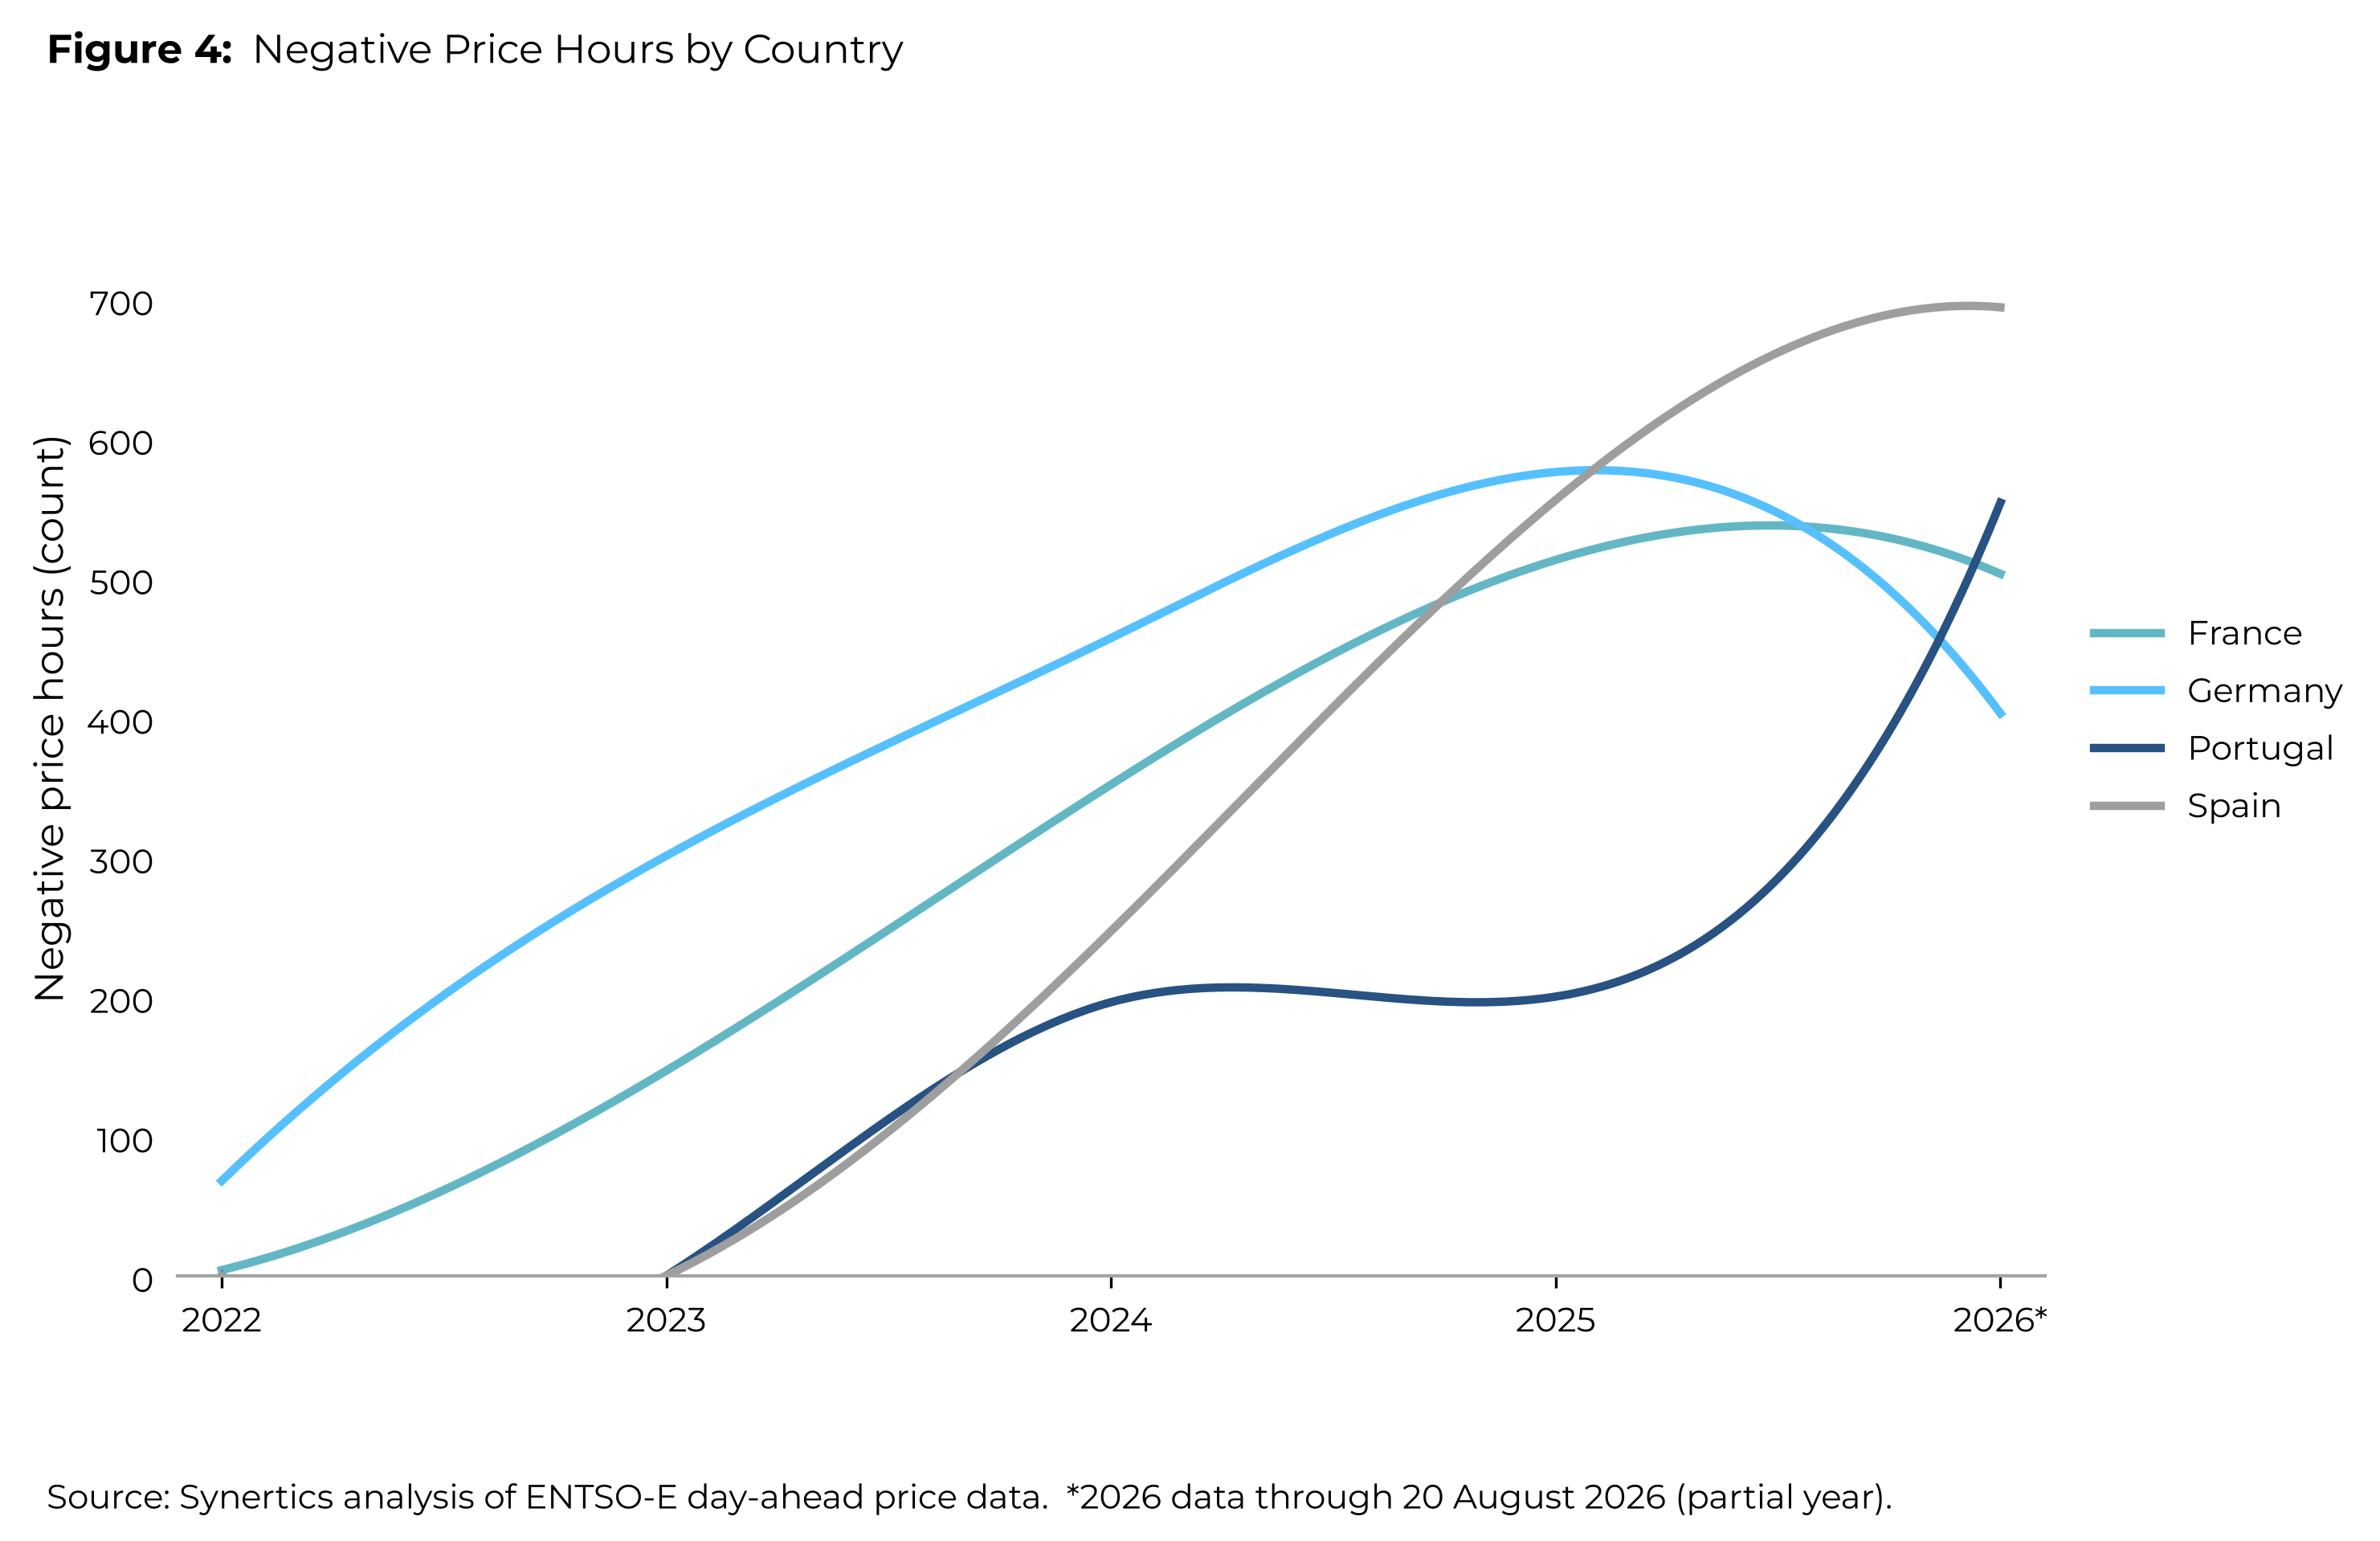
The number of hours prices go negative shows the same decline from a different angle and makes clear it isn't slowing down. Spain and Portugal recorded zero negative-price hours in both 2022 and 2023, then the floor gave way: Spain to 247 hours in 2024 and 556 in 2025, Portugal to 196 and then 200. Both are already passed last year's full-year totals in 2026, with four months still to count. Germany and France show a more gradual version of the same curve. Germany climbed steadily from 68 negative hours in 2022 to 576 in 2025, France from just 4 hours to over 500 over the same period. The apparent drop to 401 hours for Germany in 2026 isn't a reversal, it's a partial year, with several months still uncounted.
Together, the two datasets show the same mechanism playing out: solar's own concentration into a few daylight hours is what pushes prices down in exactly those hours, so the capacity growth experienced in recent years translates directly into a bigger share of output selling into the price collapse it's causing.
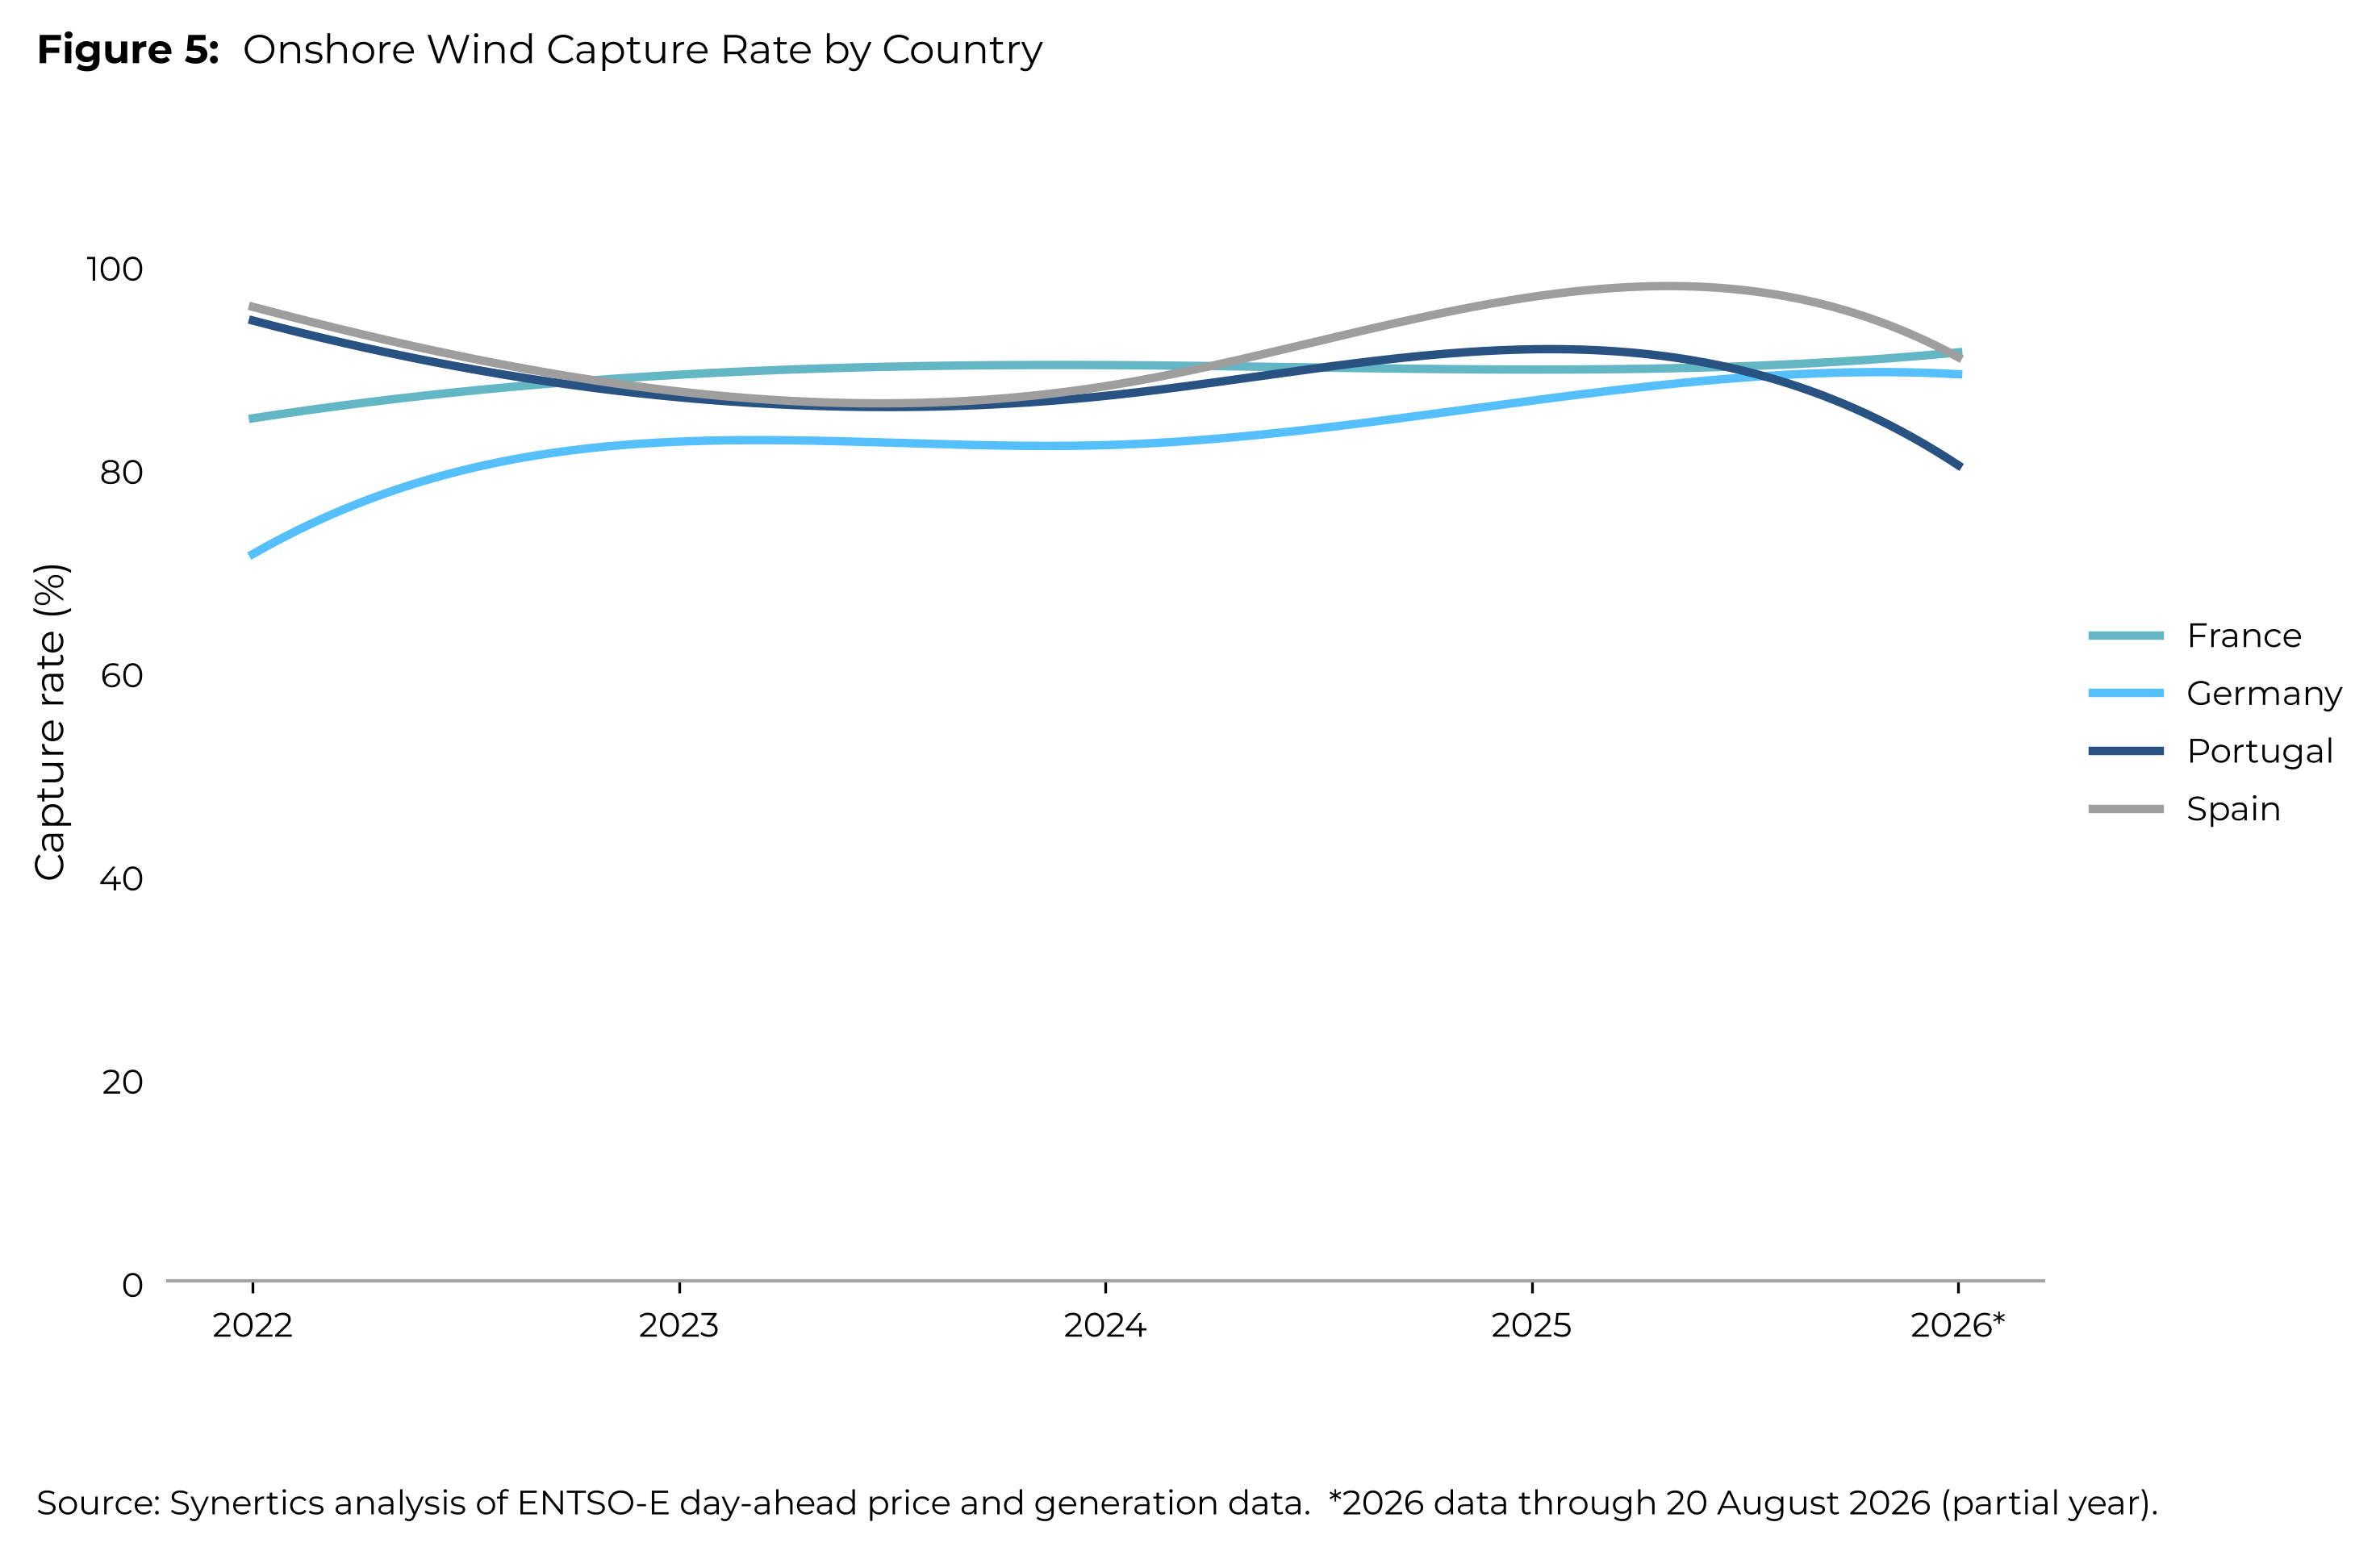
Set against solar, onshore wind's capture rates look almost stable. Across all four markets, wind capture rates have moved within an 80–97% band since 2022, with no consistent downward trend. Germany's and France's wind capture rates are higher today than they were in 2022 (71% → 89% and 85% → 91% respectively). Spain's capture rate stood at 96% in 2022 and 97% in 2025; Portugal's at 94% in 2022 and 92% in 2025. Both show a slightly lower reading so far in 2026 (91% and 80%), though with four months of the year still to count, that's not yet a confirmed trend.
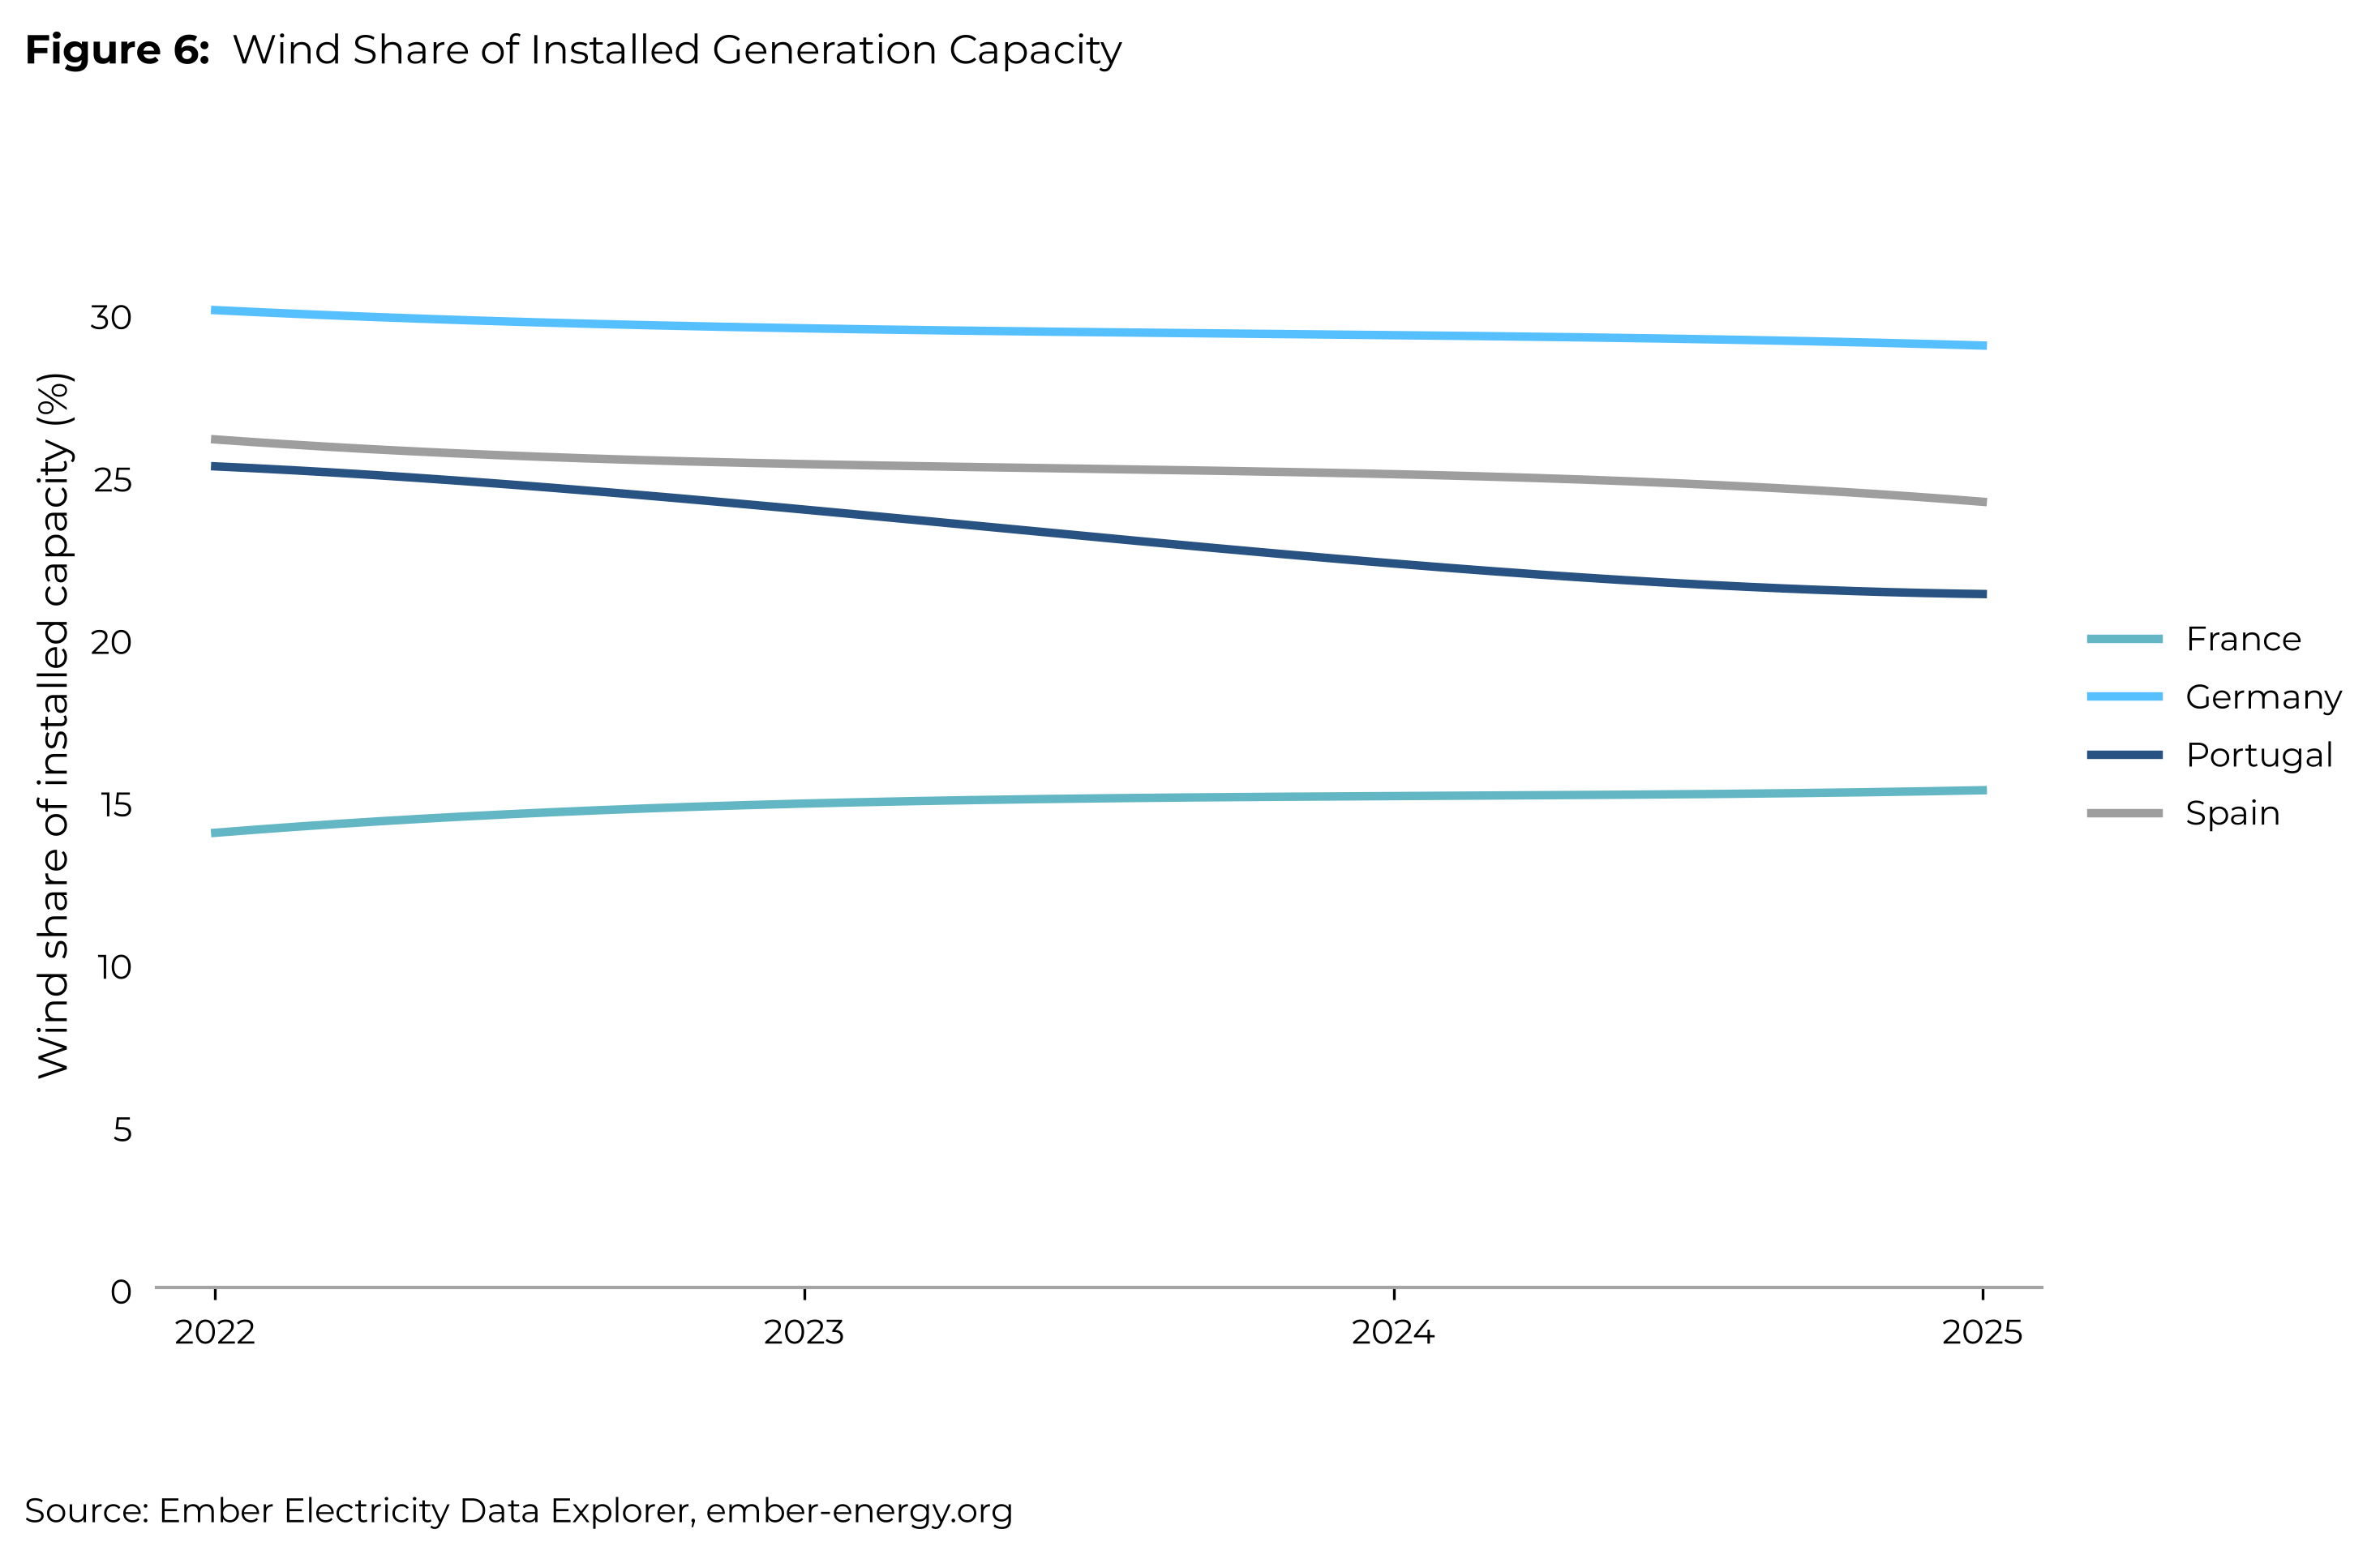
The reason is straightforward: wind capacity has grown far more slowly than solar capacity everywhere in this data set, and wind output is spread more evenly across the day and across seasons, so it isn't piling into the same narrow price window the way solar is.
What this means for PPA pricing and bankability
The pattern across all four markets points to the same conclusion for anyone structuring a solar PPA today: annual average price assumptions increasingly understate the real risk. A pay-as-produced structure priced off a flat annual capture assumption will systematically overstate expected revenue in markets where cannibalisation is advancing quickly, because it doesn't account for the growing share of output landing in negative or near-zero price hours.
A few practical implications follow directly from the data:
Four years of data across Germany, Spain, France and Portugal point to the same conclusion: solar's own growth is what's driving its prices down. As capacity has expanded, capture rates have fallen and negative-price hours have gone from rare to routine. Wind's relative stability over the same period isn't luck, it's what happens when generation doesn't all land in the same few hours of the day.
For developers and offtakers alike, the practical response isn't to avoid solar PPAs, it's to price them with cannibalisation explicitly built in, through fixed-shape structures, floor provisions, and increasingly, storage. Our capture price explainer walks through how we calculate this at a market level, and you can sign up here to get access to SEMT and model it for your own project. At Synertics, we help both sides of the table structure PPAs that hold up as the market keeps moving. Get in touch to talk through how these dynamics affect your specific market and technology mix.

 3 min
3 min
Market-trends
14th Oct, 2026
6 min
Market-trends
14th Oct, 2026
2 min
Market-trends
1st Oct, 2026